Radon In Water: How it gets there and How to Get Rid of It
Radon is one of the more perplexing and misunderstood issues in home water treatment. The material below is excerpted from several sources, especially from an excellent Penn State University Extension services publication.
Radon is a colorless, tasteless, odorless, radioactive gas. It is formed from the decay of radium in soil, rock, and water and can be found worldwide.
The radon in the air in your home generally comes from two sources: the soil or the water supply. It escapes from the earth’s crust through cracks and crevices in bedrock, and either seeps through foundation cracks or through poorly sealed areas into basements and homes, or it dissolves in the groundwater. Radon can be trapped in buildings where it can increase to dangerous levels. Radon entering your home’s air supply through the soil is typically a much larger risk than the amount of radon In general, radon is of much greater danger when it enters through the soil than when it enters via the water supply.
Radon can be inhaled from the air or ingested from water. Inhalation of radon increases the chances of lung cancer and this risk is much larger than the risk of stomach cancer from swallowing water with a high radon concentration. Generally, ingested waterborne radon is not a major cause for concern. The extent of the effects and the risk estimates involved are difficult to determine. According to the EPA’s 2003 Assessment of Risks from Radon in Homes, radon is estimated to cause about 21,000 lung cancer deaths per year. The National Research Council’s report, Risk Assessment of Radon in Drinking Water, estimates that radon in drinking water causes about 160 cancer deaths per year due to inhalation and 20 stomach cancer deaths per year due to ingestion.
Radon in water usually originates in water wells that are drilled into bedrock containing radon gas. Radon usually does not occur in significant concentrations in surface waters.
Dissolved radon in groundwater will escape into indoor air during showering, laundering, and dish washing. Estimates are that indoor air concentrations increase by approximately 1 pCi/L for every 10,000 pCi/L in water. For example, a water well containing 2,000 pCi/L of radon would be expected to contribute 0.2 pCi/L to the indoor air radon concentration. Based on the potential for cancer, the EPA suggests that indoor air should not exceed 4 picocuries per liter (pCi/L).
EPA and various states have recommended drinking water standards for radon in water ranging from 300 to 10,000 pCi/L but no standard currently exists. One study of radon present in over 900 Pennsylvania water wells found that 78% exceeded 300 pCi/L, 52% exceeded 1,000 pCi/L and 10% exceeded 5,000 pCi/L.
Since most exposure to radon is from air, testing of indoor air is the simplest method to determine the overall risk of radon in your home. Test kits for indoor air radon are inexpensive and readily available at most home supply stores.
Testing for radon in water is also inexpensive but requires special sampling and laboratory analysis techniques that measure its presence before it escapes from the sample. Test kits are available from various private testing labs
The presence of waterborne radon indicates that radon is probably also entering the house through the soil into the basement which is generally the predominant source. Therefore, treating the water without reducing other sources of incoming airborne radon probably will not eliminate the radon threat. Therefore, you should also test the air in your home for radon.
Treating Radon in Water
The main objective of water treatment is removing radon from water before the radon can become airborne. Most water treatment, therefore, focuses on “point of entry” rather than “point of use.”
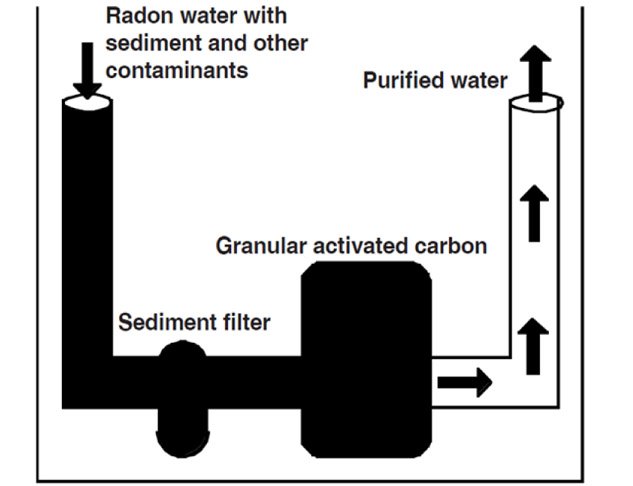
Granular Activated Carbon (GAC)
One method for removing radon from water is with a granular activated carbon (GAC) unit. Although these systems come in a variety of models, types and sizes, they all follow the same principle for removal . The standard radon GAC filter is a tank-style unit that can have either a backwashing control or a simple non-backwashing head. Non-backwashing GAC units must be protected from sediment with a prefilter. Radon filter sizing depends on the amount of radon present, service flow rates, amount of water treated, the size of the treatment bed and other factors, so each application must be considered separately and radon testing for effectiveness of the filter should be carried out regularly.
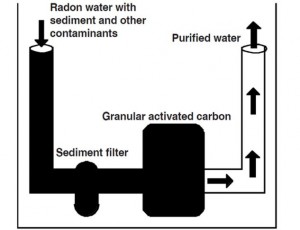
Typical setup for a GAC filter treating radon.
Various estimates suggest that GAC should only be used on water supplies with a maximum radon concentration of less than 30,000 pCi/L. If you do decide to purchase a unit, select a filter size that matches your water use and conditions. According to EPA, a three-cubic-foot unit can handle as much as 250 gallons of water per day and effectively reduce radon levels. Typical water use in the home ranges from 50 to 100 gallons per person per day.
A major drawback to the use of GAC filters for radon removal is the eventual buildup of radioactivity within the filter. For this reason, the GAC unit should be placed outside the home or in an isolated part of the basement to minimize exposure. The carbon may also need to be replaced annually to reduce the hazard of accumulated radioactivity. Spent GAC filters used for radon removal may need special disposal. Disposal of spent carbon should be in compliance with local waste disposal regulations.
GAC treatment units are frequently also installed to remove chlorine, pesticides, petroleum products, and various odors in water. In these cases, the GAC filter may unknowingly be accumulating radioactivity as it removes radon from the water. Radon should always be tested for and considered as a potential hazard with the use of GAC filters.
Aeration
EPA has listed aeration as the best available technology for removing radon from water. Home aeration units physically agitate the water to allow the dissolved radon gas to be collected and vented to the outside. With new technological advancements in home aeration, these units can have radon removal efficiencies of up to 99.9%. Standard aeration treatment units typically cost $3,000 to $5,000 including installation. Be aware that aeration specifically for radon reduction is not the same as aeration for iron or hydrogen sulfide reduction. While “closed tank” systems designed for iron and sulfide reduction might help with radon, they are not designed to provide the large ventilation capacity needed to assure release of radon to the atmosphere.
When considering installation of aeration units, other water quality issues must be taken into account, such as levels of iron, manganese and other contaminants. Water with high levels of these types of contaminants may need to be pre-treated in order to prevent clogging the aeration unit. Disinfection equipment may also be recommended since some aeration units can allow bacterial contamination into the water system.
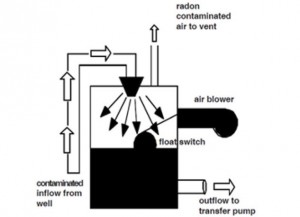
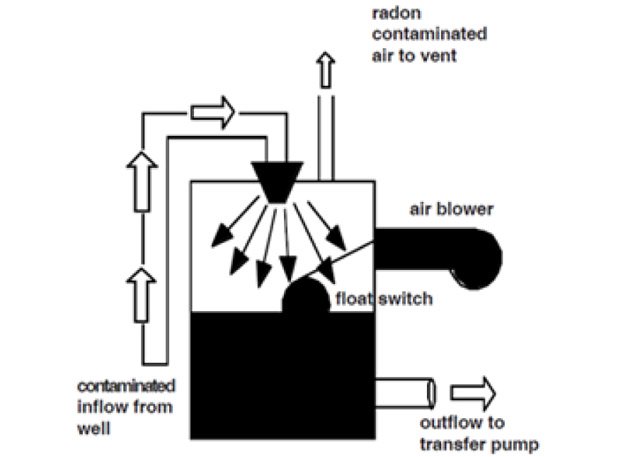
Typical Spray Aeration System Designed for Radon Reduction in a Private Home
There are several styles of aeration treatment units but all work on the same principle of aerating or agitating the water to allow the radon gas to escape so it can be captured and vented. Each type of unit has advantages and disadvantages. One of the more common styles is a spray aeration unit shown above. In this case, water containing radon is sprayed into a tank using a nozzle. The increased surface area of the sprayed water droplets causes the radon to come out of the water as a gas while the air blower carries the radon gas to a vent outside the home. About 50% of the radon will be removed in the initial spraying so the water must be sprayed several times to increase removal efficiencies. To keep a supply of treated water, a 100-gallon or larger holding tank must be used.
Another common aeration unit is the packed column where water moves through a thin film of inert packing material in a column. The air blower forces radon contaminated air back through the column to an outdoor vent. If the column is high enough, removal efficiencies can reach 95%.
Another type of aeration system uses a shallow tray to contact air and water. Water is sprayed into the tray, and then flows over the tray as air is sprayed up through tiny holes in the tray bottom. The system removes more than 99.9% of the radon and vents it outside the home. Go here for illustrations of other aeration systems.
See also: the EPA publication and a list of resources from RadonResources.com.
Main Source: Penn State University.
Pure Water Gazette Fair Use Statement