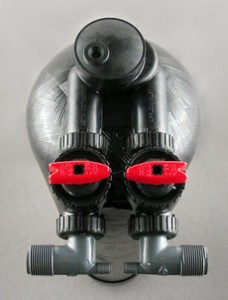
Replacing Media in ScaleNet (OneFlow) TAC Units

scalenetunittop

Media replacement is an easy job on TAC units because only a small amount of media is needed. Residential units use only 2 to 4 liters of TAC media. Be sure you have the right amount of media for your unit before you start. As a rule of thumb, a liter of media treats a service flow of four gallons per minute, so an 8-gpm system would need 2 liters of replacement medium.

  1. Turn the water to the unit off, either with an upstream valve or by putting the red-handled bypass valve into bypass position. (It’s safer to just turn off the water.)
  2. Open a downstream tap to let off pressure.   When no water is coming from the open downstream tap, it’s safe to remove the cap from the tank.
  3. Disconnect the unit using the two black plastic nuts that connect the tank to the bypass valve. If a tool is need, channel-lock pliers, gently applied, are preferred.
  4. Screw the valve off of the tank. It removes counter-clockwise.  It’s like screwing a cap off of a bottle.
  5. On older units, the center pipe (riser tube) stays in the tank.  In new units, the riser tube is inserted into the bottom of the head and comes out with the head when the head is removed from the tank.
  6. When the head has been removed, simply pour the old media out of the tank. It is a good idea to rinse the tank out with a garden hose before replacing the media.
  7. When the tank is empty and clean, pour the new media into the tank and screw the head back onto the tank. In units where the center tube stays in the tank, be careful not to pour media into the tube. Be sure the tank threads are clean and no media is in the threads. It is a good idea to lube the o ring at the bottom of the head lightly with silicone grease. Screw the head snugly onto the tank, hand tight. No tools needed.
  8. Reconnect the head to the house plumbing, then turn on the inlet valve part way and let the system fill with water slowly.  Turn off the water and let the  media soak for half an hour.
  9. Turn on the water and allow water to run slowly through the system and out the open downstream tap for five minutes. It is normal for a few media particles to rinse out of the open tap during startup. After the five minute rinse, check for leaks, and the unit is back in service.


Perfluorinated chemicals and polyfluoroalkyl substances: What are we going to call them?

pfoaimage

One of the hardest things about understanding the “emerging” water contaminants that come from firefighting foams, certain food packaging, non-stick cookware, treated clothing, etc. is figuring out what to call them.  Terms like perfluorooctane, polyfluoroalkyl and perfuoorooctanic acid don’t roll off the tongue easily.

To simplify things, we normally resort to acronyms.  It’s easier to say TCE than Trichloroethylene and everyone has caught on that THMs stands for Trihalomenthanes. However, with these new chemicals acronyms only seem to muddy the water. There are just too many chemicals (way too many to count at this point) with too many names and there are too many ways to classify them. They almost all start with “P” but “P Words” doesn’t seem like a good thing to call them.

We, at PWP (Pure Water Products), have been calling them PFCs, which stands for Perfluorinated Chemicals, as an umbrella term to categorize them under. This seemed reasonable enough to us,  but as the WQA (Water Quality Association) list below indicates, PFCs can be ambiguous.

A recent WQA  presentation created to educate its members put out some rules for naming and classifying these chemicals.  Here are the main things to remember:

PFCs can mean two different things: Perfluorinated chemicals or a subset of perfluorinated chemicals called perfluorocarbons.

PFO and PFOS do not fall under perfluorocarbons.

PFASs can be an abbreviation for either: per-  or polyfluoroalkyl substances.

Currently, the CDC ( Centers for Disease Control)  is using PFCs for perfluorinated chemicals and the EPA (Environmental Protection Agency)  is using PFOS to collectively describe PFOA and PFOS and other chemicals in this group.

Individual state regulatory agencies randomly mix both the CDC and EPA designations. 

The WQA itself uses PFASs as an umbrella term. 

Other terms you hear include PFNAs, which stands for perfluorononanoic acids, which are part of the larger PFAS group.

Then, to complicate things further, there is the much publicized GenX, also know as C8, which was created by DuPont as a purported less harmful version of PFOA.  Rogue terms like GenX and C8, of course, made our initial PWS (P Word Substances) plan unusable.

PFCs is what we were using as an umbrella term until the WQA pointed out that PFCs can be ambiguous and declared it should be PFASs. To compromise, we’ve renamed our article category for the P contaminants PFCs,PFASs, hoping to please as many acronymed authorities as possible and to be as visible as possible to web searches.


Clean Water Act dramatically cut pollution in U.S. waterways

by Kara Manke

The 1972 Clean Water Act has driven significant improvements in U.S. water quality, according to the first comprehensive study of water pollution over the past several decades, by researchers at UC Berkeley and Iowa State University.

The team analyzed data from 50 million water quality measurements collected at 240,000 monitoring sites throughout the U.S. between 1962 and 2001. Most of 25 water pollution measures showed improvement, including an increase in dissolved oxygen concentrations and a decrease in fecal coliform bacteria. The share of rivers safe for fishing increased by 12 percent between 1972 and 2001.

Despite clear improvements in water quality, almost all of 20 recent economic analyses estimate that the costs of the Clean Water Act consistently outweigh the benefits, the team found in work also coauthored with researchers from Cornell University. These numbers are at odds with other environmental regulations like the Clean Air Act, which show much higher benefits compared to costs.

“Water pollution has declined dramatically, and the Clean Water Act contributed substantially to these declines,” said Joseph Shapiro, an associate professor of agricultural and resource economics in the College of Natural Resources at UC Berkeley. “So we were shocked to find that the measured benefit numbers were so low compared to the costs.”

The researchers propose that these studies may be discounting certain benefits, including improvements to public health or a reduction in industrial chemicals not included in current water quality testing.

The analyses appear in a pair of studies published in the Quarterly Journal of Economics and the Proceedings of the National Academy of Sciences.

Cleaning up our streams and rivers

Americans are worried about clean water. In Gallup polls, water pollution is consistently ranked as Americans’ top environmental concern – higher than air pollution and climate change.

Since its inception, the Clean Water Act has imposed environmental regulations on individuals and industries that dump waste into waterways, and has led to $650 billion in expenditure due to grants the federal government provided municipalities to build sewage treatment plants or improve upon existing facilities.

However, comprehensive analyses of water quality have been hindered by the sheer diversity of data sources, with many measurements coming from local agencies rather than national organizations.

To perform their analysis, Shapiro and David Keiser, an assistant professor of economics at Iowa State University, had to compile data from three national water quality data repositories. They also tracked down the date and location of each municipal grant, an undertaking that required three Freedom of Information Act requests.

“Air pollution and greenhouse gas measurements are typically automated and standard, while water pollution is more often a person going out in a boat and dipping something in the water.” Shapiro said. “It was an incredibly data and time-intensive project to get all of these water pollution measures together and then analyze them in a way that was comparable over time and space.”

In addition to the overall decrease in water pollution, the team found that water quality downstream of sewage treatment plants improved significantly after municipalities received grants to improve wastewater treatment. They also calculated that it costs approximately $1.5 million to make one mile of river fishable for one year.

Comparing costs and benefits

Adding up all the costs and benefits — both monetary and non-monetary — of a policy is one way to value its effectiveness. The costs of an environmental policy like the Clean Water Act can include direct expenditures, such as the $650 billion in spending due to grants to municipalities, and indirect investments, such as the costs to companies to improve wastewater treatment. Benefits can include increases in waterfront housing prices or decreases in the travel to find a good fishing or swimming spot.

The researchers conducted their own cost-benefit analysis of the Clean Water Act municipal grants, and combined it with 19 other recent analyses carried out by hydrologists and the EPA. They found that, on average, the measured economic benefits of the legislation were less than half of the total costs. However, these numbers might not paint the whole picture, Shapiro said.

“Many of these studies count little or no benefit of cleaning up rivers, lakes, and streams for human health because they assume that if we drink the water, it goes through a separate purification process, and no matter how dirty the water in the river is, it’s not going to affect people’s health,” Shapiro said.  “The recent controversy in Flint, MI, recently seems contrary to that view.”

“Similarly, drinking water treatment plants test for a few hundred different chemicals and U.S. industry produces closer to 70,000, and so it is possible there are chemicals that existing studies don’t measure that have important consequences for well-being,” Shapiro said.

Even if the costs outweigh the benefits, Shapiro stresses that Americans should not have to compromise their passion for clean water — or give up on the Clean Water Act.

“There are many ways to improve water quality, and it is quite plausible that some of them are excellent investments, and some of them are not great investments,” Shapiro said. “So it is plausible both that it is important and valuable to improve water quality, and that some investments that the U.S. has made in recent years don’t pass a benefit-cost test.”

Source: Berkeley News

Pure Water Gazette Fair Use Statement

PFC Highlights


Posted October 8th, 2018

What We Know About PFCs

  • PFCs are a class of chemicals that get into drinking water mostly from airports and non-stick cookware. They also originate from industries that create packaging, clothing, and carpeting.
  • The United States has been identified as one of the world hot spots for PFC contamination.
  • Wherever there are manufacturing facilities, airports, or high populations you will find PFCs in the drinking water and in people’s blood.
  • The PFC contamination that has been discovered up to now is just the tip of the iceberg. The worst is to come.
  • There are estimated to be over 3,000 chemicals in the PFC class used globally. The EPA has only looked at a handful of these chemicals, including PFOA and PFOS. Those two were phased out in 2015 but they persist in the environment and drinking water. One of the major obstacles researchers face is that they only have methods for testing for some 39 of the thousands of chemicals that exist.
  • PFCs are stable in the environment so they don’t break down easily and they bioaccumulate in the body. A CDC study in 2004 found multiple PFCs in almost every individual tested.
  • We know most about the chemicals that have been phased out and least about the chemicals that are still in use. What we really know nothing about is the effects of a cocktail of these chemicals in the human body.
  • The Water Quality Association has identified and verified as effective treatments through testing as effective treatment, verified through testing by the WQA, includes anion exchange, reverse osmosis, and carbon filtration.
  • The Water Quality Association has identified and verified through testing the best known treatments for PFCs. These are anion exchange, reverse osmosis, and carbon filtration.

Information above was gathered from a WQA radio podcast featuring speaker Eric Yeggy.


The Very Popular “Single Tank” Aeration Systems for Iron and Hydrogen Sulfide Have Issues


A particular style of iron/manganese/hydrogen sulfide filter that has become very popular in recent years combines aeration in the same treatment tank with the filter media. These are sold under a variety of names, like AIO, “iron breaker,” and “iron ox.”  (We call them “single tank aerators.”)  It is understandable that they are popular.  They are effective removers of reasonable amounts of iron, manganese, and hydrogen sulfide, they cost less than most alternative methods, they save space, and they are relatively easy to install.

How They Work

Single tank aerators are built like a standard backwashing filter with iron/sulfide media like Filox, Birm, Katalox, or Catalytic Carbon in a “mineral tank” with a control valve on top to backwash the media. They differ from standard filters, however, in that the control valve is a water softener valve that has been modified to draw in air instead of a brine solution. During regeneration, the control valve draws in and stores air in the filter tank. During the service run, this compressed air is used to speed up precipitation of the targeted contaminants. Since air is taken in only during regeneration, the regeneration process has to happen often. In most cases, a daily regeneration is required for residential treatment.

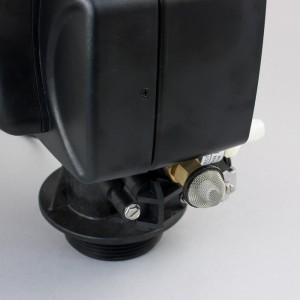
5600aio

In air-induction units, air is drawn in through the screen-protected port during the daily regeneration cycle.

Issues To Consider

There are a couple of issues that should be kept in mind if you’re considering getting a single tank aeration/filtration unit. One is water usage. Single tank units have to regenerate every night, and they use more water per regeneration than conventional non-aerating filters. The table below looks at water usage for a typical 10″ X 54″ single tank aeration iron filter as compared with a non-aerating conventional iron filter of the same size.  The chart assumes that the iron level is moderate and the iron filter can be regenerated every third day. The aerating filter must be regenerated every night to maintain its air charge.

Water Usage of a Conventional Iron Filter vs. an Air Draw Filter


Air Draw Unit, regenerating every day.

Conventional Backwashing Filter, regenerating every third day.

Regular Backwash Cycle 10 minutes @ 5 gpm. Total: 50 gallons. 10 minutes @ 5 gpm. Total: 50 gallons.
Air Draw Cycle 40 minutes @ 1 gpm. Total: 40 gallons. No air draw cycle. Total: 0.
Rinse Cycle 1 minute @ 5 gpm. Total: 5. 2 minutes @ 5 gpm. Total: 10.
Total Gallons Per Regeneration: 95 Total Gallons Per Regeneration: 60
Total Gallons Per Year: 34,675 gallons. Total Gallons Per Year: 7,300 gallons.

Stated differently, while a conventional iron filter may use 140 gallons of water per week, an air-induction filter of the same size will use about 665 gallons per week. This is water that is drawn from the well and also waste water that has to be disposed of.

Keep in mind, of course, that the aerating system can be much more effective than the conventional filter working without an oxidizing agent. Air provides pre-treatment that could also be done with oxidizers like chlorine, hydrogen peroxide, potassium permanganate, or ozone–all of which come with their own problems and disadvantages. Keep in mind, too, that there are other forms of aeration. The old venturi or “micronizer” systems use no water at all, and the free-standing compressor-p0wered aeration systems (AerMax, for example), cost more initially but are more effective and use only about 2 per cent as much water as the AIO units. (A  Pure Water Occasional back issue has a concise explanation of how all three aeration systems work.)

Another issue to be considered is upkeep. Filter control valves running on clean city water usually go years without internal parts failures. Not so with well water filters that have to deal with contaminants like iron and high sediment levels. Filter control valves have inner seals that degrade when exposed to harsh water conditions.  Such degradation is regarded as normal wear and tear, and well owners should expect to do fairly frequent maintenance on inner control valve parts like pistons and seals and spacers. While this is true of all iron filters, single tank aeration units are much more prone than standard units to experiencing inner gasket failures.  This is probably due in part to frequency of regeneration but it is more specifically because the 40-minute daily air draw cycle dries out and corrodes sensitive inner parts and leads to early failure.

Single tank aerators offer a quick and relatively inexpensive solution to well water problems, but buyers should be aware that they have some drawbacks.

Measuring our “Water Footprint”


Posted October 4th, 2018

Meat-Free Diets Could Cut Our ‘Water Footprint’ In Half, Say Scientists

By Ben Keane


Three thousand litres of water – that is the amount needed to produce the food each British person eats every day. This is according to a new study into the “water footprint” of diets in Western Europe, conducted by the European Commission and published in Nature Sustainability.

The term “carbon footprint”, which accounts for all the emissions of CO₂ associated with the manufacture or production of an item, has become commonplace in recent years. Similarly, the “water footprint” of food can be calculated using information on the amount of water required during cultivation and processing.

The authors of this new study, led by EC scientist Davy Vanham, first gathered existing data on the water footprint of various foods and drinks. They then combined this with census information for regions within the UK, France and Germany, and knowledge of local eating habits, to calculate how much water is used to feed people in each region and how that could be reduced. Considering the record-breaking heatwave and drought across Europe in summer 2018, their insight may have arrived just in time.

Of the three countries studied, the UK has the smallest average water footprint at 2,757 litres per person per day, in Germany the average is 2,929 and in France it’s 3,861 (for reference, people in the US use more than 9,000 litres per day). One of the standout reasons for the difference between these countries is that the French drink more wine, compared to the Germans and the British who prefer beer, which has a smaller water footprint.

Another feature of this study is the focus on smaller regions which reveals large differences within these countries. A common theme is that rural areas have higher water footprints than cities, mainly due to differences in diet. People in London, for example, eat less red meat than other regions. This is why the UK’s highest footprints (still less than France’s smallest footprint) are found in the south-west, North Yorkshire and Lincolnshire.

In Germany and France this trend manifests as a distinct north-south divide, with the French wine growing regions in the south-west using up to 5,000 litres per person per day. According to the study, another cause of differences within each country is the make up of regional populations. In London, the amount of wine consumed is closely related to the level of education of residents. In other words, water footprint increases with education.

But what does all this mean? Well, 3,000 litres a day adds up to more than a million litres per year — or enough water to fill your local swimming pool three times over. More importantly, a higher water footprint is associated with an unhealthy diet, largely due to meat requiring a lot more water than vegetables or fruit. In all three countries, people “eat too much sugar, oils and fats, (red) meat as well as milk and cheese combined,” write Vanham and colleagues, and in France and Germany “people do not eat enough fruit and vegetables.”

Eating less meat through adopting a “healthy meat” diet could reduce water footprint by up to 35%, the authors say. An even greater saving can be made if meat is replaced by fish, lowering water footprint by 55%, but interestingly moving completely to a vegetarian diet makes around the same savings. Making such changes will not only save water, but will have the additional benefit of improving diet in countries where more than a third of people are overweight and around a quarter obese.

Convincing people to make such a change to their eating habits will not be simple. A number of suggestions are put forward in the study, including punitive measures for “unhealthy” foods, such as a sugar tax. However, such approaches are controversial, with considerable evidence suggesting that they are harmful to low income families. A more subtle approach would be to change the layout of supermarkets, “nudging” shoppers towards more healthy purchases.

Finally, the authors acknowledge that education of the population in dietary matters will be key. But, as their own analysis shows, more education is associated with higher wine consumption, which increases the water footprint.The Conversation

Ben Keane is a Postdoctoral Researcher, Soil and Plant Science, at the University of Sheffield.

This article is republished from The Conversation.

Pure Water Gazette Fair Use Statement