City Water: Take Nothing for Granted

fluidconceptsfilters

The two discolored carbon block cartridges in the photo turned blood red with rust stains and clogged after only two months of service at a home served by a small municipal water supply in Texas. The cartridges are 4.5″ X 20″ carbon blocks that were installed in tandem, so that each got only half of the water flowing into the home. Use was moderate.

The condition of the filters underlines the lesson that we are learning from news from Flint, Michigan and the many other poor water quality stories that are surfacing involving city water systems. The lesson is that city water is not necessarily as safe as we have always assumed–that it isn’t, in fact, being monitored to assure that every drop that comes from the treatment plant is perfect and certainly that every drop that passes through our aging delivery pipes gets to us without contamination.

The logical place to treat water to assure its excellence is at point of entry–where the water enters the home itself. Carbon filtration at point of entry and a high quality drinking water unit under the sink are becoming as common and as necessary as locks on the doors.

purauvb1

Ultraviolet treatment, once used almost exclusively on unchlorinated wells, is now becoming a common fixture in city homes as “boil water” alerts and disinfection failures become more common.  UV provides a margin of safety even where water is chlorinated.

EPA Superfund


Posted April 15th, 2016

New Sites Added to the EPA Superfund’s National Priorities List

superfundsite1

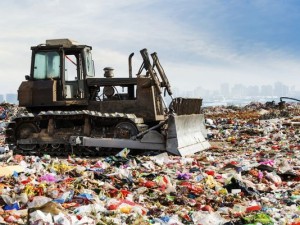
The U.S. Environmental Protection Agency (EPA) added five and proposed to add eight hazardous waste sites to the Superfund program’s National Priorities List (NPL). These are sites with known or threatened hazardous waste releases that could pose risks to public health, water quality,  and the environment.

“Cleaning up hazardous waste sites is vitally important to the health of America’s communities,” Mathy Stanislaus, assistant administrator for EPA’s Office of Land and Emergency Management, said. “Our goal is to give communities the best opportunity for productive use of a site after it is cleaned up.”

Superfund Cleanups Have Documented Health Benefits to Communities

A site’s addition to the NPL helps address potential adverse human health impacts.  Academic research shows that investment in Superfund cleanups reduces the incidence of congenital abnormalities in infants by as much as 25% for those living within approximately a mile and a quarter of a site.

Cleanups involving lead-contaminated soil have contributed to documented reduced blood-lead levels in children. If left unaddressed, elevated blood-lead levels may result in irreversible neurological deficits, such as lowered intelligence and attention-related behavioral problems.

Cleanups Stimulate the Local Economy

“Adding a site to the NPL generates new jobs and creates stronger local economies that will strengthen communities for years to come,” Stanislaus continued. “A study by researchers at Duke University and the University of Pittsburgh found that once a site has all cleanup remedies in place and is deleted from the NPL, nearby property values increased 18.6% to 24.5% as compared to their pre-NPL proposal values. Moreover, cleanups increase local communities’ and state governments’ tax revenue, and help to create jobs during and after cleanup. For example, at 454 of the 850 sites supporting use or reuse activities, EPA found, at the end of fiscal year 2015, that approximately 3,900 businesses had ongoing operations that were generating annual sales of more than $29 billion and employing more than 108,000 people.”

Cleanups Make Unusable Properties Usable

More than 850 Superfund sites nationwide have some type of actual or planned reuse underway.

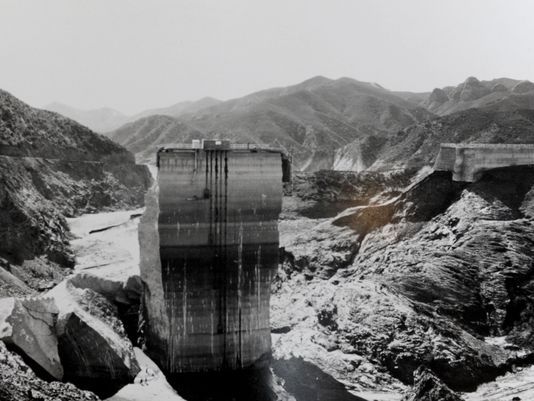
For example, in the town of Corinna, Maine, the Maine Department of Environmental Protection, local officials and stakeholders worked together to integrate a reuse plan for the Eastland Woolen Mill Superfund site. The 22-acre site is a former textile mill that operated from 1909 to 1996. Disposal practices resulted in extensive contamination of soil, groundwater and numerous private drinking water wells.

With EPA support, this collaboration resulted in the Corinna Village Center Reuse Plan, which focuses on mixed-use redevelopment of downtown Corinna and includes commercial, residential and recreational areas.

superfund2

Superfund Action Makes Polluters Pay for Cleaning Up the Messes They Create

Under Superfund law, only sites EPA adds to the NPL are eligible to receive federal funding for long-term, permanent cleanup. The list serves as the basis for prioritizing both enforcement actions against potentially responsible parties and long-term EPA Superfund cleanup funding. The Superfund program operates on the principle that polluters should pay for the cleanups rather than passing the costs on to taxpayers. EPA searches for parties legally responsible for contaminating a site, and holds those parties accountable for cleanup costs.

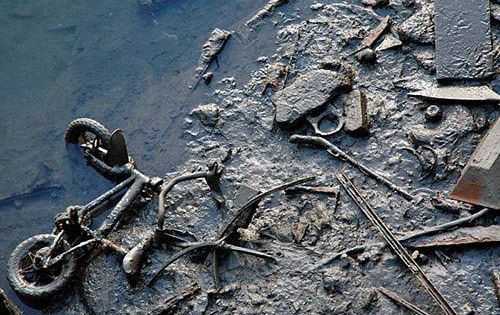
The sites in today’s rules potentially affect drinking water, groundwater, soil, wetlands and fishing for human consumption. Contaminants found at the sites include arsenic, mercury, uranium, cadmium, copper, manganese, zinc, aluminum, chromium, lead, trichloroethane (TCA) and trichloroethylene (TCE).

The following five sites were added to the NPL in April,1015:

1. Illinois – Old American Zinc Plant (former zinc smelter) in Fairmont City

2. Iowa – PCE Former Dry Cleaner (former dry cleaner) in Atlantic

3. Nebraska – Iowa-Nebraska Light & Power Co. (former gas plant manufacturer) in Norfolk

4. New Jersey – Former Kil-Tone Co. (former pesticides manufacturer) in Vineland

5. New Mexico – Lea and West Second Street (groundwater plume) in Roswell

The following eight sites have been proposed for addition to the NPL:

1. California – Argonaut Mine (former hard rock mining area) in Jackson

2. Colorado – Bonita Peak Mining District (former hard rock mining area) in San Juan County

3. Indiana – Riverside Ground Water Contamination (groundwater plume) in Indianapolis

4. New York – Wappinger Creek (site of various former industrial operations) in Dutchess County

5. Ohio – Valley Pike VOCs (former tire and heavy duty truck molding manufacturer) in Riverside

6. Puerto Rico – Dorado Ground Water Contamination (groundwater contamination) in Dorado

7. Texas – Eldorado Chemical Co. Inc. (former cleaning products manufacturer) in Live Oak

8. West Virginia – North 25th Street Glass and Zinc (former glass and zinc manufacturer) in Clarksburg

Access to the federal register notices and supporting documents for the final and proposed sites; how a site is listed on the NPL; information about the Superfund Redevelopment Initiative; information on the 35th anniversary of Superfund; and information on the Comprehensive Environmental Response, Compensation and Liability Act can be found on the EPA website.

Learn more about the Superfund from the EPA Website. 


How long does a water molecule stay in a river?

watermolecule

A typical water molecule will stick around in an ocean for, on average, a few thousand years. In rivers, a water molecule won’t dawdle as long — just a couple weeks to several months. But a water molecule hunkered down in groundwater might be around for 10,000 years.

Scientists have a name for how long water molecules remain in any given system: “residence time.” And “transit” or “travel” time is how long it takes for water to get through a system.

Kevin McGuire, PhD, an associate professor of hydrology at Virginia Tech, explains the difference like this: If you could take the age of every human being on the planet right now, you would get an average age — or the average time, at this moment, that people reside on Earth. That’s “residence” time.

But that, McGuire says, is different from taking the average age of everyone who passes away today — those who pass through the system of life. That would be the “transit” time.

But going back to water, residence time and transit time are crucial measurements when it comes to taking care of this critical natural resource.

Measuring a moving target

Getting a grip on these numbers can help us understand and protect our environment. They can be used for things like predicting how a pollutant will affect any given system, or how quickly pollution might move through a system. Scientists, given better ways to track water and its movements, might be able to show more accurately how much water is in any given system, or how safe that water is, or how it might be replaced.

But those numbers aren’t easy to figure out. “The idea of this water residence time, or the travel time or the age, it’s really sort of where some of the cutting-edge science is,” says McGuire. “We’ve had a theory for some time to suggest that we need to go after this. It’s like a Holy Grail.”

And to figure out how water slips from one place to the next — or how long it stays put — scientists have to measure “tracers” in the water. Think of them as water-based fingerprints. “You have to have something in the water that moves like the water,” McGuire says.

One widely used tracer is tritium, a radioactive isotope in hydrogen. Tritium occurs naturally only in small amounts, but nuclear bomb testing in the late 1950s and ‘60s released much more into the atmosphere, and that is now tracked by scientists. Compounds like chlorofluorocarbons in water can be tracked, too.

Getting a grip on water

Because residence times and transit times are only estimations, the findings will differ depending on who’s doing the measuring, what method they’re using and a host of other factors. For example, the Spokane Aquifer Joint Board in Washington state uses this chart from a 1979 book, “Groundwater,” that estimates the residence time in oceans and seas to be about 4,000 years. The authors of that book estimated the residence time of rivers to be about two weeks and all the water in the part of the atmosphere that supports life to be less than a week.

Another example: Italian scientists measured the transit time and residence time in a defined body of water — the Adriatic Sea — and even then, the numbers differed depending on where the “tracers” enter the sea. The authors figured the average transit time in the Adriatic is 170 to 185 days. The residence time averaged 150 to 168 days.

Gathering the data

The challenge now in determining these numbers is getting enough data. The technology to gather and analyze samples has been prohibitively expensive until the last decade or so, McGuire says.

That’s getting better, McGuire says, providing more data to crunch and more accurate numbers in the hands of the people caring for different water sources. And it comes none too soon.

According to the United Nations, more than 2 million tons of sewage drain into the world’s waters every day, and every year more people die from unsafe water than die from all forms of violence, including war, according to the United Nations. The World Health Organization reports more than 1 billion people have no access to safe drinking water. By some estimates, 2.200 children die every day from diarrhea caused by unsafe drinking water.

Of all the water in the world, only about 3 percent is freshwater, and some 68 percent of that is locked up in glaciers and ice, according to the U.S. Geological Survey. With so much of that endangered, it’s more important than ever to find ways to use it wisely.

Source: Mother Nature Network.  The source article includes videos.

Pure Water Gazette Fair Use Statement

Gazette Famous Water Pictures: The St. Francis Dam

stfrancisdam1

The ill-fated St. Francis Dam, shown above, became one of the largest but least discussed man made tragedies in US History when it burst in 1928, killing some 450 people.

The St. Francis Dam was a curved concrete gravity dam, built to create a large regulating and storage reservoir for the City of Los Angeles. The reservoir was an integral part of the city’s Los Angeles Aqueduct water supply infrastructure. It was located in San Francisquito Canyon of the Sierra Pelona Mountains, about 40 miles (64 km) northwest of Downtown Los Angeles, and approximately 10 miles (16 km) north of the present day city of Santa Clarita.

The dam was designed and built between 1924 and 1926 by the Los Angeles Department of Water and Power, then named the Bureau of Water Works and Supply. The department was under the direction of its General Manager and Chief Engineer, William Mulholland.

At 11:57 PM on March 12, 1928, the dam catastrophically failed, and the resulting flood took the lives of as many as 431 people. The collapse of the St. Francis Dam is considered to be one of the worst American civil engineering disasters of the 20th century and remains the second-greatest loss of life in California’s history, after the1906 San Francisco earthquake and fire. The disaster marked the end of Mulholland’s career.

stfrancisdam4


St. Francis Dam, after the deluge.

Newsweek Video Account