Goodbye, Aral Sea

By Eric Holthaus

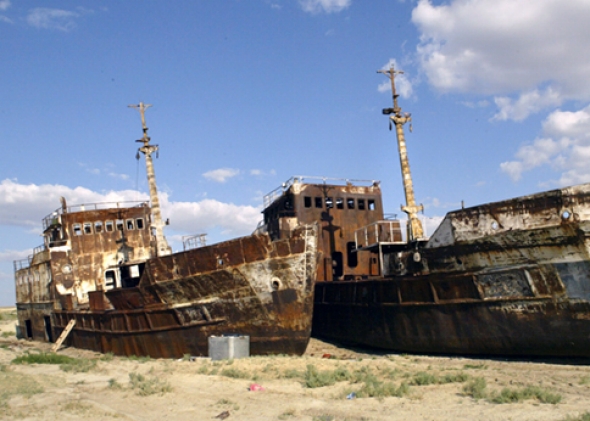
 The Aral Sea, once the world’s 4th largest lake, is now officially dry. The story is not one of global warming.  It is one of human irresponsibility. The photo shows shipwrecks where the Aral Sea once was.

The Aral Sea—a huge part of it at least—is no more.

According to NASA, “for the first time in modern history, the eastern basin of the South Aral Sea has completely dried.”

Humans have been farming the Aral Sea area in Central Asia for centuries, and the lake has gone through spectacular boom-and-bust cycles in the past. But the lake hasn’t been this dry in a long, long time. Speaking with NASA, Philip Micklin, a geographer emeritus from Western Michigan University, said, “it is likely the first time it has completely dried in 600 years, since Medieval desiccation associated with diversion of Amu Darya to the Caspian Sea.”

In the early 1900s, the Aral Sea was the fourth largest lake in the world. It has been dwindling since the 1960s, when a Soviet program of irrigated agriculture diverted the region’s major two rivers, the Amu Darya and the Syr Darya, largely to grow lucrative but water-intensive cotton. Sound familiar, California?

Since the Soviet Union dissolved, things have only gotten worse. According to a report (PDF) by the United Nations Environment Programme, more than 60 million people now live in the Aral region, up fourfold since 1960. At the same time, inflows into the lake are down sharply, a phenomenon possibly linked to climate change. With the help of the World Bank, in 2005 Kazakhstan built a dam as a last-ditch effort to save part of the lake, with mixed results. According to NASA, this year’s final push toward record-low lake levels came as a result of low snowpack in the mountains that feed the lake.

This isn’t a story of climate change, though. It’s a story of barreling ahead with the status quo amid a superfluity of stop signs. Rice and cotton fields are still widespread in the Aral region, though oil and gas exploration in the dry lake bed is becoming more common, too.

Without the steadying influence of the lake on local weather, winters in the surrounding region are now colder, and summers are hotter and drier. Blowing dust, laced with agricultural chemicals that have built up as a result of runoff into the lake over the years, has contaminated surrounding communities. This is not a place you’d want to live.

The tragedy of the Aral Sea should be a cautionary tale for people in the increasingly water-scarce American Southwest. After all, we have our own fair share of Aral Seas here, too. About 100 years ago, eager California farmers drained Lake Tulare, then the largest freshwater lake west of the Mississippi. More recently, Hoover Dam’s Lake Mead, now at record-low levels, has lost its title as the biggest reservoir in the country. (As of February of this year, it had fallen all the way to fourth.) Lake Shasta, the largest reservoir in California, is starting this year’s rainy season at only 26 percent of total capacity,

There’s tenuous hope that California is finally starting to recognize the dire situation the mix of agriculture, urban growth, and climate fluctuations have put them in before it’s too late. California’s legislature recently passed a series of measures that will regulate groundwater pumping, the last Western state to do so. Last week, the governor signed the bill into law.

As for the desiccating Aral region, there’s nowhere to go from here but up.

Source:  Slate.com.

Pure Water Gazette Fair Use Statement
US announces world’s largest marine sanctuary in the Pacific 


Washington: The United States on Thursday announced the creation of the world’s largest marine sanctuary in the Pacific, where commercial fishing and energy exploration are off limits.

The move expands the already existing Pacific Remote Islands Marine National Monument, west of Hawaii and northeast of Australia to six times its previous size.

“We’re talking about an area of ocean that’s nearly twice the size of Texas, and that will be protected in perpetuity from commercial fishing and other resource-extraction activities, like deep-water mining,” said Secretary of State John Kerry.

Former president George W Bush declared the area a national monument in 2009, and an executive order from President Barack Obama makes the protected space even larger. The total protected area now includes 490,000 square miles (1.27 million square kilometers) around the Wake and Jarvis Islands and Johnston Atoll.

“This is the grand-daddy of all marine protected areas around the world. Some of these areas had like a 50-mile radius around them, now they are going to have a 200-mile radius,” said Jackie Savitz, vice president for US oceans at the advocacy group Oceana.

A key goal is to protect the undersea mountains that provide habitat and hunting grounds for tuna, sea turtles, manta rays, and sharks, and to allow them to breed and multiply.

The area “is also home to millions of seabirds that forage over hundreds of miles and bring food back to their rookeries on the islands and atolls,” the White House said in a statement.

Coral reefs that are in peril from bleaching and ocean acidification are plentiful in the area, and protecting them allows scientists to use them as a benchmark for global research on climate change.

The marine protected area is considered federal land where commercial fishing is prohibited. However, some recreational fishing will continue to be allowed, with special permits.

Biologists at the US Fish and Wildlife Service say the establishment of the protected area has already helped boost some creatures that had all but disappeared at Johnson Atoll.

They include “Great Frigatebirds, Sooty Terns, Red-tailed Tropicbirds, and other species that are known to feed as much as 300 to 600 miles offshore,” the statement said. Obama first announced plans to expand the marine reserve in June at a two-day conference on the world’s oceans, hosted by the State Department.

With just one to three per cent of the world’s oceans currently under protection, Kerry called on global powers to take more steps to end overfishing and protect global fish stocks.

“There’s just too much money chasing too few fish,” he said.

Source: IBN Live.

Pure Water Gazette Fair Use Statement

USGS report: Pesticides contaminate nation’s streams


by Laura Lundquist

A new U.S. Geological Survey study shows that pesticides continue to infiltrate the nation’s streams, however, the types of pesticides mixing with the water are changing.

As part of a continuing survey of water quality, USGS scientists found that, over the past decade, one or more pesticides still contaminate close to 100 streams sampled nationwide, indicating that the problem is pervasive.

“The information gained through this important research is critical to the evaluation of the risks associated with existing levels of pesticides,” said William Werkheiser, USGS associate director for water.

Scientists analyzed stream samples collected regularly between 2002 and 2011 for pesticides, which include both herbicides and insecticides. They also divided streams into agricultural, urban and mixed-use categories.

The high occurrence of pesticides between 2002 and 2011 was consistent with findings from the previous decade, 1992 to 2001, but now fewer streams exceed the human health limits for pesticides. Only one stream exceeded the health standard this decade, compared to 17 percent of agricultural streams in the previous decade.

However, water quality is still bad for aquatic life, such as frogs, fish and insects. Nearly two-thirds of agricultural streams and half of mixed-use streams had pesticide concentrations that exceeded limits for aquatic life in both decades.

But urban streams became worse, with 90 percent containing pesticide concentrations exceeding aquatic life limits compared to half in the previous decade.

The authors noted a change in the pesticides present between one decade and the next, which is one of the reasons they say direct comparison between decades is problematic.

They credited most of the change to pesticide regulation by the Environmental Protection Agency causing a reduction in the use of some toxic pesticides.

For example, in the 1990s, the herbicide cyanazine was found to cause birth defects and could leach through the soil into the groundwater, so cyanazine use dropped.

Residential use of the insecticide diazinon also dropped in 2004 after it was shown to be highly toxic to birds and bees.

Concentrations of both cyanazine and diazinon have dropped in samples from the recent decade. In the meantime, though, new pesticides were developed, and their concentrations have surged.

The insecticide fipronil, for example, was approved for use as recently as 1995, so it wasn’t widely used during the first sampling decade. Since then, studies found that the fipronil concentration steadily increased in urban streams between 2000 and 2008, indicating increasing use in residential areas.

Fibronil disrupts an insect’s central nervous system. That means that, like diazinon, it also kills good insects such as honeybees.

A 2003 University of Greenwich study found that fibronil degrades into a more toxic substance that can accumulate in fish.

The recent decade of sampling found that six main pesticides, including atrazine and fipronil, were found in all streams at least half the time, and fipronil exceeded the concentration limit for aquatic life in 20 percent of streams.

The insecticides fipronil and carbaryl were found in urban streams more than half the time.

The authors say the other major change has been the switch to the herbicide glyphosate, made possible by the increased use of genetically modified crops.

Glyphosate levels weren’t included in this report because scientists can’t easily measure how much is in streams.

Some research has indicated that glyphosate is also contributing to honeybee colony collapse.

Montana streams that were sampled included the Yellowstone River at Forsyth and Sidney, and the Clarks Fork Yellowstone River near Edgar. Other rivers in the region included the Bighorn River at Kane, Wyoming, and the Teton River near St. Anthony, Idaho.

Source: Bozeman Daily Chronicle.

Pure Water Gazette Fair Use Statement

The Perfect Water for Coffee


Posted September 21st, 2014

What is the ideal water for brewing coffee?

by Gene Franks

British scientist Christopher Hendon recently published research seeking to define the perfect water for brewing coffee.  Essentially what he recommends, from the point of view of water quality, is

1. Clear,fresh, odor-free water.

2. Zero or near zero chlorine or chloramine.

3. TDS (Total Dissolved Solids) around 150 ppm.

4. Total alkalinity of around 40 ppm.

5. Calcium hardness of around 4 grains per gallon (68 ppm).

6. pH of 7.0.

7. Sodium of around 10 ppm.

The best way to get water that fits this description is simply to have non-chlorinated well water that fits this description.  The second best way is to have city water that fits the the requirements except #2 and filter out the chlorine or chloramine with carbon filtration.

Most standard water treatment strategies have their shortcomings if your entire purpose in treatment is to make excellent coffee. Here is a rundown:

A. Polyphosphate is often used by restaurants. It protects the coffee-making equipment from calcium build-up and does not affect the taste of the coffee. Some cartridges mix polyphosphate with granular carbon. This has the positive effect of removing the chlorine/chloramine.  It does not affect mineral content.

B. Distiller.  Not good for coffee.  It takes out virtually all the hardness and sodium and leaves almost zero TDS.  It will probably remove most of the chlorine.

C. Reverse Osmosis.  Not ideal for coffee. RO leaves less than 10% of the sodium/hardness content, which is too little unless you start with a whole lot.  For example if your raw water has a salty 100 ppm of sodium, RO would bring it down to the ideal figure.  RO (or the carbon filters with it) removes chlorine/chloramine, but it probably will drop the pH below the ideal 7.0.

D. Water Softener.  Not good for coffee.  Softened water has no hardness and way too much sodium. Softeners don’t remove chlorine.

E. Activated carbon filter.  Probably the best choice with most waters.  It removes chlorine and chloramine, improves taste, and doesn’t affect minerals.

F. Bottled water. Good if you find water that meets the criteria.  Bottled water can be distilled, prepared with reverse osmosis, or simply filtered spring or municipal water.  Because of the mineral content, filtered municipal water is probably your best choice.

Keep in mind that most people do a lot more with water than make coffee.  Perfect water for coffee may not be the best for bathing or drinking. It might make more sense to soften your water to protect appliances and buy a bottle of water now and then to make coffee with. “What profiteth a man if he gains good coffee but loses his hot water heater?”

Reference: Water Technology, paper issue for Sept. 2014.


Water Test Kits


Posted September 21st, 2014


 Water Testing Kits

by Dr. Joseph Cotruvo


Editor’s Note:  The selection below is excerpted from Water Technology’s popular Professor POU/POE feature. — Hardly Waite.

Providers of water services always need water quality data to evaluate the type of contamination problem they are facing, be it hardness, corrosion or microbes, to select the types of technical interventions that might be needed. There are many test kits on the market that provide good estimates of concentrations of many kinds of water parameters and contaminants. They are inexpensive and easy to use with some practice, and do not require the expertise of an analytical chemist or microbiologist, or an expensive fixed laboratory. Many can be run in the field. They always require care and cleanliness and good practices and carefully following the directions, so as to produce reliable results.

Parameters and circumstances that require an expert analytical laboratory

Of course, many analyses require complex equipment and a qualified analytical laboratory. Some examples include trace organic chemicals like THMs or pesticides, many inorganic chemicals and more complex microbial analyses like for giardia or Cryptosporidium protozoa. These could cost hundreds of dollars per sample and may require days or weeks before the results are provided. Virtually all analyses that will be used for official standards and regulatory compliance determinations will require data from a state certified laboratory. So, for example, data from public water systems to determine official compliance with chemical and microbial drinking water regulations all fall into that category. Except for standard inexpensive microbial analyses like coliform bacteria they are usually required infrequently. The good news is that there are many simpler analyses for some of the substances that even public water systems can use for tracking treatment processes and day-to-day performance.

Parameters that can be tested with kits

This is not an exhaustive list but it gives an overview of the types of kits that are available and sources of many of them. Some of these involve use of a meter and others are color or other simple tests. Among the general water parameters that can readily be tested are: pH, turbidity, temperature, alkalinity, conductivity, hardness or total dissolved solids. Chemical tests include: Chloride; free, total and combined chlorine; chlorine dioxide; chromium VI; copper; arsenic; fluoride; iron; lead; manganese; nitrate; nitrite; nickel; phenols, phosphate; sulfide; sulfite; and sulfate. Simple microbial tests include: Fecal and total coliforms; E. coli, and fecal streptococci. Some basic examples of these methods and products are described below. Many more are available in the catalogues of the various suppliers.

General parameters

Alkalinity: Available simple kits can measure alkalinity on site as calcium carbonate. Some use a small direct reading titrator. Testing ranges are about 0-200 ppm with sensitivity ~4 ppm as CaCO3. Costs for 50 tests are about $35.

pH: The measurement of pH should be done in the field rather than by taking a sample to a laboratory, because pH will change by exposure to the atmosphere, such as by losing or picking up carbon dioxide. There are battery operated pH meters suitable for field use that cost several hundred dollars each, but they can measure hundreds of samples.

Meters provide a precise measurement, but there are simpler and much less expensive ways of obtaining a very good estimate of pH. Simple litmus paper gives a quick indication of acidity or basicity. Hydrion or Universal pH paper is available at very low cost (a few cents per test) from many sources. Dipping a small strip of the paper in the water produces a color indicating the approximate pH that can be read off of a color chart.

Hardness: There are kits capable of measuring calcium hardness as calcium carbonate on site. Their performance is in the typical drinking concentration range as well as above by dilution of the sample. Cost is about $50 for a kit that can perform 50 tests.

Temperature: Water temperature is easily measured with numerous standard thermometers, but digital readout devices are also available.

Inorganic chemicals

Arsenic: Several arsenic test kits are available that will measure arsenic +3 and arsenic +5 in the low ppb range. A common technique involves adding reagents to a water sample that results in color formation on a test strip. Some tests require about 15 minutes for color production. The color on the strip is compared to a color chart to determine the concentration of total arsenic. Costs are typically about $175 to $200 for 50 samples.

Chloride: Kits for on-site chloride in fresh water samples are available using a direct reading titrator. Costs are about $50 for 50 tests.

Chlorine: There are free, total and combined chlorine test kits available from several suppliers that can quickly measure on site the three chlorine disinfection species in the range of typical drinking water concentrations. Two reagents are added to a water sample and the color formation is measured with a color comparator. Cost is about $65 for a kit that can perform 50 tests.

Copper: Copper test strips are available to measure total copper levels from 0 to 3 ppm in seconds. Colorimeter tests are available with greater precision and accuracy.

Iron: Numerous low cost field test kits are available for iron in the drinking water concentration range from about 0.5 ppm to 10 ppm. The simplest kits involve color generation with a reagent and comparison with a color chart.

Nitrate-nitrogen: Several low cost test kits are available for this important water quality parameter. They usually involve adding a solid reagent to the water in a vial and then allowing the color to develop, then inserting the vial in a color comparator.

Microbial indicators

The traditional testing for microbial indicators like coliforms once required a microbiology laboratory facility and trained microbiology technicians or microbiologists along with sample preparation equipment, and glassware and growth media and autoclaves for sterilization and temperature controlled ovens. That is no longer the case. There are now techniques available that do not require special equipment or special training beyond some basic instruction. For total coliforms andE.coli the original new test was Colilert, but numerous variants are now also available. As a presence-absence test it involves adding a special solid reagent to the water sample and storing it for 18 to 24 hours at 98F. If a yellow color develops, that indicates total coliform bacteria. If the same tube fluoresces when a UV light is shined on it that indicates the presence of E.coli. So, two important microorganisms are identified in one test in 24 hours or less with minimal facilities. The method is also amenable to multiple tube most probable number quantitations if the sample is diluted, divided and incubated. When purchased in bulk the unit costs can be in the area of $5 or $6 including sterilized containers and the reagent. Similar tests are available for enterococci and pseudomonas.

There are other simple and low cost systems available for heterotrophic, sulfate reducing, iron and pseudomonas bacteria. One group is called biological activity reaction test (BART) systems and they are available from several suppliers. All of these microorganisms can be problematic in water systems and plumbing and their identification facilitates selection and application of corrective actions.


Source: Water Technology.

Pure Water Gazette Fair Use Statement

Beer: a magical mixture of hops, barley, and tiny pieces of plastic


by Liz Core

Plastics are everywhere: on the street, in our refrigerators, all over the oceans — you name it. But now they’re hitting us where it really hurts. Authors of a new study published in the latest edition of Food Additives and Contaminants found traces of plastic particles (and other debris … we’ll get to this later) in beer.

This is how the study worked: Researchers lab-tested samples of 24 varieties of German beers, including 10 of the nation’s most popular brands. Through their superpowers of microscopic analysis, the team discovered plastic microfibers in 100 percent of the tested beer samples.

Reads the study:

“The small numbers of microplastic items in beer in themselves may not be alarming, but their occurrence in a beverage as common as beer indicates that the human environment is contaminated by micro-sized synthetic polymers to a far-reaching extent.”

It’s not breaking news that plastics don’t just vanish into the ether when we’re finished with them. Unless you haven’t heard, in which case … BREAKING NEWS: The plastics we use today will stick around longer than your great-great-great-great (and then some) grandchildren.

Water bottles and sandwich bags could potentially take up to 500 years to decompose. Here’s why: plastics don’t biodegrade, they photodegrade (or, when exposed to light, disintegrate into a million little pieces). Those pieces stick around for centuries, making their way into any and all ecosystems on the planet — and, apparently, into the amber contents of our steins.

While none of the beer in the recent study contained enough plastic to be imminently harmful to public health, the plastic invasion of our brewskies is a wake-up call that plastic waste is penetrating our entire human environment.

Oh, and those other unwelcome ingredients I mentioned? They included exfoliated skin cells, tiny shards of glass, and an almost-whole dead insect. The grossness level reaches Fear Factor caliber (except for the bug — who knows, maybe they’re hopping on the bug-eating bandwagon), which can mainly be attributed to filthy work conditions in large-scale breweries.

This study’s going to be big news in Deutschland, as Germans take their beer very, very seriously. Germany boasts a 500 year-old beer-purity law insisting brewers include only three ingredients in the brewing process: barley, hops, and water (yeast was added later). At least for the next 500 years or so — or until we can eradicate plastics forever and ever, amen — they’ll have to allow a few other ingredients, too.

Source: Grist.

Pure Water Gazette Fair Use Statement

The California Drought in Pictures


Posted September 17th, 2014

 Pictures Say it Better Than Words


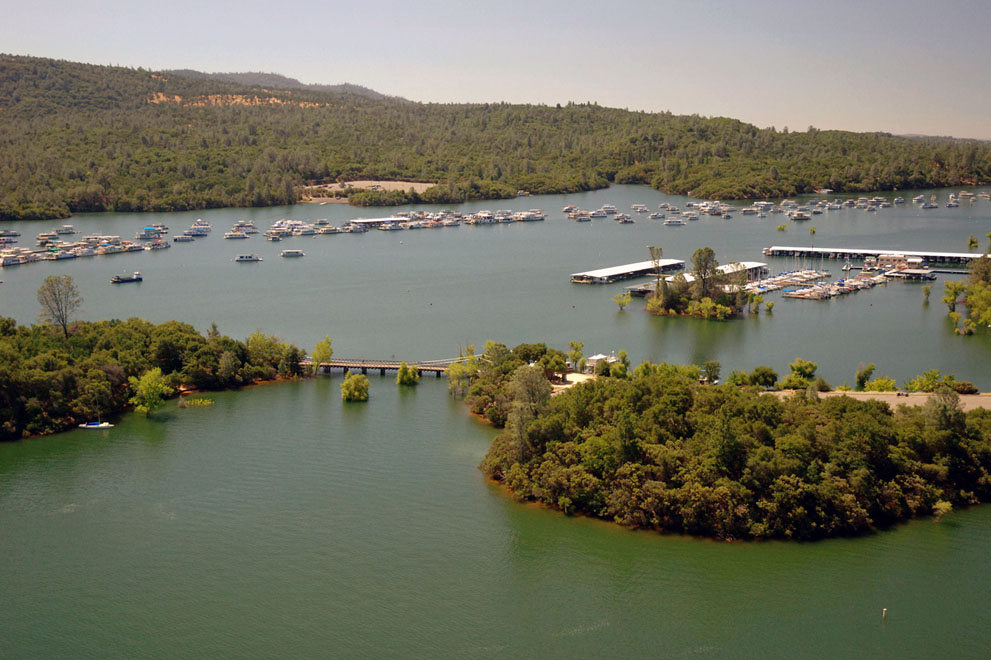
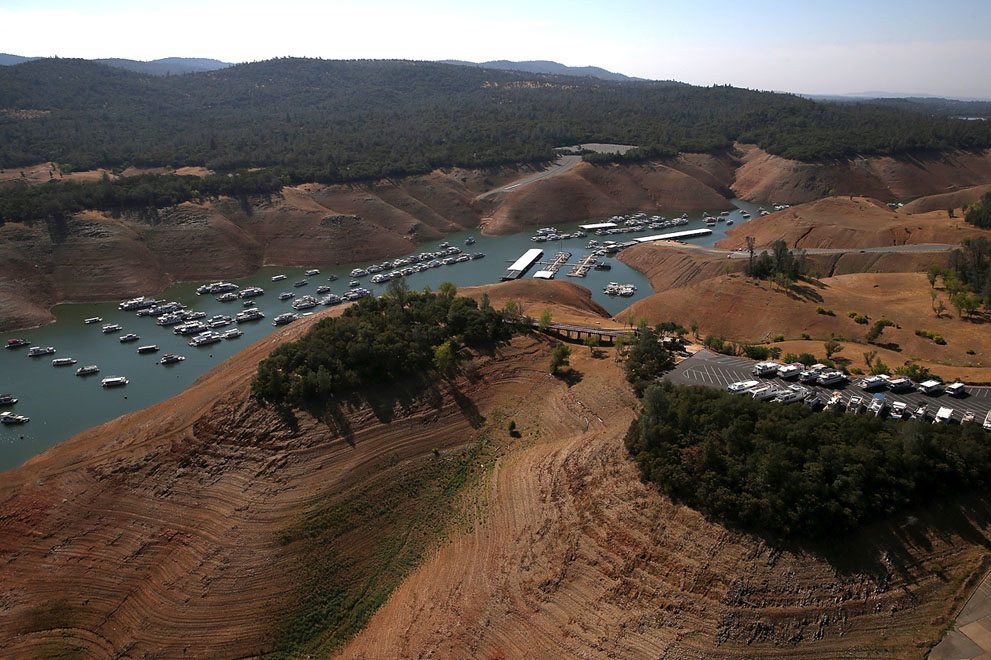
Sometimes words aren’t enough to describe the impact of the devastating drought in California.  The Atlantic has published a set of pictures that say it better than words.  Here is a sample:


Bidwell Marina at Lake Oroville on July 20, 2011.


 Bidwell Marina at Lake Oroville on August 19, 2014.


Please see the full Atlantic photo essay.

Pure Water Gazette Fair Use Statement


Super-rich make last stand against California drought

In one of America’s richest towns residents are paying more than ten times the going rate for water in a desperate attempt to stave off California’s “epochal” drought

by Nick Allen

Sept. 13, 2014

The home of Tom Cruise in Montecito, California 


Nestled under the Santa Ynez mountains and cooled by the Pacific Ocean breeze, the billionaires’ bolt hole of Montecito, California, seems at first glance like a palm tree-strewn idyll.

Here, in one of America’s wealthiest post codes, celebrities including Oprah Winfrey, George Lucas, Rob Lowe, Kevin Costner and Ellen DeGeneres live alongside CEOs too numerous to mention in some of the world’s biggest and most outlandish homes.

But look a little closer and it is soon apparent there is trouble in this paradise: not even the likes of Miss Winfrey, it seems, can make it rain.

As California endures what the state’s governor Jerry Brown has called a drought of “epochal” proportions, lawns everywhere – including one at a five-acre property owned by the chat show queen – are scorched and gone to seed.

A polo field also lies unwatered and, according to locals, some owners of $10 million (£6.2 million) homes are eating off paper plates to avoid using their dishwashers.

In February the Montecito Water District imposed savage cuts on more than 10,000 residents. It announced overall water use would have to fall by 30 per cent or the town would run out in months. Big users saw their water allocation cut by up to 90 per cent.

Some residents continued to splurge water from sprinklers so the district levied millions of dollars in fines, eventually threatening to cut off completely those who have been hogging too much water.

In a desperate bid to save their manicured lawns and towering topiary, some of Montecito’s multi-millionaires have since been trying to out-spend nature by buying water in from outside.

Each morning at the crack of dawn, trucks laden with precious H₂O trundle down lanes towards parched estates.

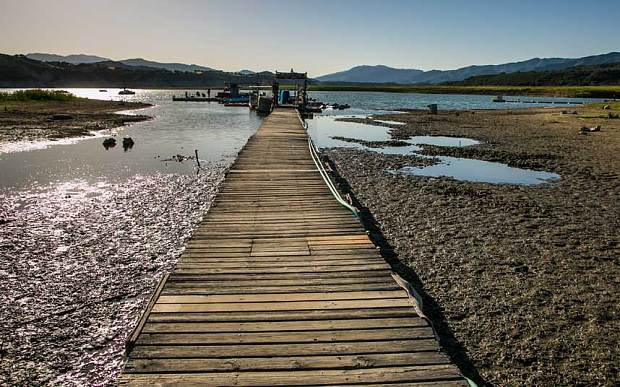
Lake Cachuma, the primary source of drinking water in Santa Barbara, Montecito, and other cities along California’s Central Coast, has dropped 50 feet and is at 35% capacity.

The buyers are paying up to $80 (£49) a unit – a unit is 748 gallons – for water that normally costs a maximum of $6.86 (£4.23) a unit from the water district.

The trucks are now a common sight in Montecito, passing by Sotheby’s International Realty and an haute couture clothes store. But the origin of the water is something of a mystery.

“I see the trucks every day. They’re like big gas trucks with a water sign on,” said Tori Delgado, who works in the Montecito wine and cheese shop. “But nobody knows where they’re getting it from.”

The water is likely being sold by private individuals elsewhere in California who have wells on their properties.

But wherever it comes from the buyers appear to be staving off the inevitable only temporarily, and many millionaires are turning to conservation instead. Miss Winfrey is prominent among them.

“Two months ago she just said, ‘Turn off the water’, and now there’s not a green blade of grass on that lawn,” a resident who has seen her parched garden told the Telegraph.

At Miss Winfrey’s second and larger Montecito estate – an $85 million affair called Promised Land – the grass is still green but the water bill has also fallen dramatically.

The Montecito Water District has so far banned the watering of gardens in the middle of the day, filling swimming pools at any time, and the building of new homes.

Meanwhile scores of angry residents have lodged appeals for more water. One asked for a supply to save 300 specimen trees – but was told the trees would have to die.

Tom Mosby, general manager of Montecito Water District, said: “People come to us and say ‘We want to build a swimming pool’ and we say ‘No’. If it doesn’t rain next year the state’s going to go dry. We are talking about a disaster movie in the making.”

About 80 per cent of Montecito’s water currently comes from Lake Cachuma, a once mighty reservoir 30 minutes drive away. Like many California reservoirs it is now surrounded by a giant white “bath tub ring”. Cachuma is more than two thirds empty.

Some are now adhering to Governor Brown’s call for people to flush the toilet less often. John Braid, 83, said: “I do that. Leave it for a day. You’re just wasting water.”

The drastic measures appear to be working. In August overall water use was down by 50 per cent on the same month last year.

That is largely due to the efforts of Montecitans like Larry Reiche whose allocation from the water district was cut by 60 per cent in February.

Mr Reiche spent $200,000 “drought proofing” his exquisite home on a hill overlooking the ocean.

He ripped up 3,500 sq ft of lawn and replaced it with artificial turf, pulled out a dozen palm trees and turned off his fountains. Thirsty plants were replaced with cacti. Showers are down to five minutes. He also used infrared technology to find a leaking pipe.

Looking out at the beautiful, but increasingly brown, vista below, Mr Reiche said: “It doesn’t matter how much money you have, if you run out of water you’re screwed. It’s a great leveller.

“Gone are the days in California when you could throw water around. This is a desert and people have to realise if we run out of water it’s going to return to desert.”

Pat Nesbitt, who owns a 71-acre estate including a polo field, had his water allocation cut by 90 per cent. If he continued to use water at the same rate he was facing fines of $140,000 in a single month.

“We cut back. We don’t water anything any more,” he said. “The polo field is brown. We are still able to play but it doesn’t play as good.”

Several million dollars of landscaping has also not been watered. Mr Nesbitt accused the water district of “incompetence,” adding: “If they had done something before, we wouldn’t be facing these draconian restrictions.”

He trucked water in once but is now drilling his own well instead. Dozens of other Montecito residents have also applied to drill wells, which can cost up to $100,000 – and could eventually cause to the subterranean aquifers beneath their feet to run dry.

Mr Nesbitt said: “I’m getting five gallons a minute, eight hours a day out of it at the moment. Not much. Pray for rain, that’s the only solution.”

On the street near Miss Winfrey’s favorite restaurant, Trattoria Mollie, the talk is of little but the drought.

There are rumours of people sending laundry out of town to avoid water fines. Some residents are said to have painted their lawns green.

According to one story a resident’s poodle turned green after rolling in the paint.

“We don’t like the water trucks because they destroy our roads,” one woman complained. “My lawn’s brown but we just have to pray for rain.”

Meanwhile, a local newspaper advised residents not to waste water taking part in the Ice Bucket Challenge. “Think about how to re-use water,” it said. “Take a bucket’s worth from the pool and have it dumped on you in the pool.”


Source: The Telegraph.


Pure Water Gazette Fair Use Statement

How Many One-Inch Pipes Will Fit Inside a Two-Inch Pipe?

by Pure Water Annie

In this article Gazette technical wizard Pure Water Annie channels another technical writer, Ryan Lessing, of Watts Water Quality.

In a recent Watts email newsletter, the Water Pro Insider, Watts engineering department technician Ryan Lessing’s technical tips column focuses on a frequent misconception about pipe sizes and flow rates.  This is good information to know even if you aren’t a plumber.  If you are a plumber, you’d better know it, but if you’re just building a fish pond or running a water pipe to your barn or adding a sprinkler to water your blackberry vines. you can get into a lot of trouble if you don’t take pipe sizes into account.  Here’s what Ryan has to say:
From time to time I hear people say “I have a 2″ pipe so I am going to install two 1″ filters in parallel.” Or they state something like “I needed the flow rate of a 3″ pipe so I ran two 1½” pipes in parallel.”

Flow rate and pipe size correlation is not as simple as adding pipe diameters together, such as 1″ pipe + 1″ pipe = 2″ pipe. The rule of thumb is twice the diameter equals four times the flow. You can see in the figure that four 1″ pipes can fit inside a 2″ pipe.

To estimate the pipe size required for a certain flow rate, the following formula can be used.

Diameter X Diameter X 2.448 X Velocity in Feet per Second = Gallons per Minute

Use a maximum flow velocity of 8.2 feet per second.

The formula works for estimating pipe size requirements for short runs, such as 20 linear feet, in the installation plumbing only. It is not intended for longer plumbing runs, where more details need to be taken into account.

So for 2″ pipe, the formula would call for 80 GPM peak flow rate:

2″ X 2″ X 2.448 X 8.2 = 80 GPM

Or for 1″ pipe, the formula would call for 20 GPM peak flow rate:

1″ X 1″ X 2.448 X 8.2 = 20 GPM

Notice how 80 GPM for 2″ pipe is 4 times as much as the 20 GPM for 1″.

As a final note, I’m sure you noticed how much Ryan’s logo is like mine. Except to point out that my logo was made before color pictures were invented, I’ll leave it to you to figure out who has borrowed from whom.

Ryan Lessing formerly worked for Alamo Water in San Antonio and has been with Watts in San Antonio for several years. He is an active supporter of the Texas Water Quality Association chapter and is a past-president of the organization.  He is also a bluegrass musician and a very nice person.

Fracking’s Wastewater, Poorly Understood, Is Analyzed for First Time

By Zahra Hirji

Researchers determined general chemical footprint of one liter samples, but not relative concentrations, and call for further study.

new study in the journal Environmental Science: Processes and Impacts offers one of the most comprehensive analyses yet of what’s in a type of waste called produced water, a poorly understood and controversial by-product of fracking.

This peer-reviewed study by a pair of researchers at Rice University in Houston shows that while fracking-produced water shouldn’t be allowed near drinking water, it’s less toxic than similar waste from coal-bed methane mining. It also revealed how the contents of this waste differ dramatically across three major shale plays: Texas’ Eagle Ford, New Mexico’s Barnett and Pennsylvania’s Marcellus.

Fracking involves injecting a slurry of water, chemicals and sand down a well to crack open shale bedrock and extract oil and gas. The study defines produced water as the water that flows out of a well after fossil fuel extraction starts. It includes some of the slurry first injected down a well, as well as naturally occurring water and materials from deep underground, such as salts, heavy metals and radioactive material.

Previous studies have examined the salinity of this waste and even some of the inorganic chemicals. Building from that, the Rice researchers identified 25 inorganic chemicals in the waste. Of those, at least six were found at levels that would make the water unsafe to drink—barium, chromium, copper, mercury, arsenic and antimony. Depending on the chemical, consuming it at high levels can cause high blood pressure, skin damage, liver or kidney damage, stomach issues, or cancer.

But the study’s innovation involved examining and identifying over 50 organic chemicals in the waste—an area that’s been little studied previously. Some of these are potentially dangerous, depending on their concentrations, such as the cancer-causing toluene and ethylbenzene; however, such levels were not provided.

Study author Andrew Barron said the results showed that produced water “was not quite as bad as we thought.”

For example, a related cancer-causing chemical called benzene, which is often seen in oil-and-gas products and waste, was not detected. Moreover, another set of cancer-causing chemicals found in similar wastewater associated with coal-bed methane mining was not observed.

Researchers did not look closely at the waste’s naturally occurring radioactive materials.

Wilma Subra, an environmental consultant from Louisiana, told InsideClimate News in an email that the lack of benzene was “surprising.” Subra, who works extensively in South Texas’ Eagle Ford, added that she would have liked the study to cover radioactive materials, which Texans are especially concerned about.

Cracking the Case

According to the study authors, the most surprising find was the presence of group of organic compounds called halocarbons, some of which are potentially toxic. These chemicals are not native to the geology of the area being drilled; nor are they found in the man-made fluids purposefully injected down a well during fracking.

Eventually, the researchers cracked the chemical case and fingered waste treatment as the source. A common type of waste treatment uses chlorine to strip dirty water of bacteria. When this chlorinated water is then injected down a well, it potentially reacts with materials in the local geology to form halocarbons. In other words, researchers found traces of a waste treatment process in pre-treated waste. How does that happen?

To understand, let’s walk through the waste-handling process.

A single fracked well can use over 2 million gallons of water. Instead of constantly relying on freshwater for this, drillers are increasingly treating and then reusing produced water, along with other types of fracking wastewater.

Now imagine that there are two wells: A and B. For Well A, drillers use only freshwater. In the resulting waste, there are no halocarbons. But some of that waste then gets treated with chlorine.

A mix of freshwater and treated water is then shipped to the second site and injected into Well B. According to the researchers, the chlorinated water likely then reacts with the naturally occurring salty water deep underground. This reaction forms entirely new chemicals—halocarbons—that show up in Well B’s waste. Since so many operators are reusing waste at current operations, it makes sense that halocarbons are seen across all the study’s samples, which were collected from wells less than a year old.

Barron, the study author, said the observed levels of these inorganic compounds are minimal and “not a cause for panic.”

At higher levels, however, some of the observed halocarbons—including a type called organobromides, which has been associated with liver damage—could pose a public health risk. And their unanticipated presence indicates that the way wastewater is treated should be reviewed, said Barron, a professor of material science who holds the Welch Chair of Chemistry at Rice. Starting this year, Barron also serves as a scientist at the Energy Safety Research Institute in the United Kingdom, a country looking to expand fracking.

The investigation, which took more than a year, has implications for oil-and-gas operators in water-strapped states such as Texas, which is in the midst of a drought. Such states are increasingly looking to reuse wastewater rather than continually relying on precious fresh water. Just last year, Texas oil-and-gas regulators at the Railroad Commission passed new rules encouraging operators to reuse more of their waste from oil-and-gas drilling.

“What the authors have shown here is interesting and intriguing,” said Lee Ferguson, an associate professor of civil and environmental engineering at Duke University, in Durham, N.C. Ferguson, who was not involved with the research, called it a starting point for further study.

A First Step

The study was funded by the Robert A. Welch Foundation, which supports research in chemistry, and the Ser Cymru programme, a health-and-environment research initiative launched by the Welsh government.

According to Barron, the authors first encountered produced water in their research for the Navy. They were looking at ways to design wetsuits that were salt permeable but impermeable to oil and gas molecules. Their cursory encounter with produced water made them realize there was still a lot to know about it—and that interest grew into this separate analysis.

Wearing gloves, Barron and his colleague, Samuel Maguire-Boyle, gathered produced water samples in specially cleaned one-liter Mason jars from three different well sites in the three different shale regions. At each site, they collected approximately 19 jars of produced water from storage tanks that connect directly to a well.

The report details the analyses of only three sites, one from each shale play. However, Barron noted, samples were collected from a dozen well sites and the three samples covered in the report were representative of that larger survey.

After stripping the water of any solids, the scientists used mass spectrometry to analyze the liquid. This analytical technique provides a unique signal for each targeted compound. The researchers then matched these signals with those from an industry database.

According to Duke’s Ferguson, this method is good for determining a general chemical footprint of a sample but it’s not always exact, because many compounds have similar profiles. To be absolutely confident in their results, he suggested that the researchers perform additional analysis. Moreover, he pointed out that the paper doesn’t provide the relative concentrations of the organic compounds, making it very difficult to determine their levels.

Barron said the group did additional analysis to determine relative levels “within a narrow range,” but he said more samples are needed to confirm them.

Barron hopes to replicate this study eventually at more well sites and determine how the composition of produced water varies within a single shale play.

Source: Inside Climate News.

Pure Water Gazette Fair Use Statement