Gazette’s Great Water Pictures Series

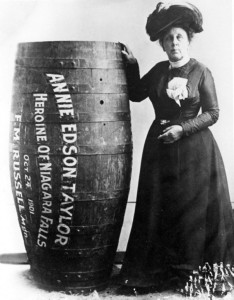
Annie Edson Taylor and Her Famous Barrel


Annie Edson Taylor (October 24, 1838 – April 29, 1921) was an American adventurer who, on her 63rd birthday, October 24, 1901, became the first person to survive a trip over Niagara Falls in a barrel.

Annie Edson Taylor’s trip over Niagara Falls in a barrel brought her some attention for a short time but never the fortune she hoped for. Here’s an account of the event from history.com.

On October 24 in 1901, a 63-year-old schoolteacher named Annie Edson Taylor becomes the first person to take the plunge over Niagara Falls in a barrel.

After her husband died in the Civil War, the New York-born Taylor moved all over the U. S. before settling in Bay City, Michigan, around 1898. In July 1901, while reading an article about the Pan-American Exposition in Buffalo, she learned of the growing popularity of two enormous waterfalls located on the border of upstate New York and Canada. Strapped for cash and seeking fame, Taylor came up with the perfect attention-getting stunt: She would go over Niagara Falls in a barrel.

Taylor was not the first person to attempt the plunge over the famous falls. In October 1829, Sam Patch, known as the Yankee Leaper, survived jumping down the 175-foot Horseshoe Falls of the Niagara River, on the Canadian side of the border. More than 70 years later, Taylor chose to take the ride on her birthday, October 24. (She claimed she was in her 40s, but genealogical records later showed she was 63.) With the help of two assistants, Taylor strapped herself into a leather harness inside an old wooden pickle barrel five feet high and three feet in diameter. With cushions lining the barrel to break her fall, Taylor was towed by a small boat into the middle of the fast-flowing Niagara River and cut loose.

Knocked violently from side to side by the rapids and then propelled over the edge of Horseshoe Falls, Taylor reached the shore alive, if a bit battered, around 20 minutes after her journey began. After a brief flurry of photo-ops and speaking engagements, Taylor’s fame cooled, and she was unable to make the fortune for which she had hoped. She did, however, inspire a number of copy-cat daredevils. Between 1901 and 1995, 15 people went over the falls; 10 of them survived. Among those who died were Jesse Sharp, who took the plunge in a kayak in 1990, and Robert Overcracker, who used a jet ski in 1995. No matter the method, going over Niagara Falls is illegal, and survivors face charges and stiff fines on either side of the border.


Pure Water Gazette Fair Use Statement


 Gold Standard Fluoride Review Contradicts New Zealand Advice

new review just released by the Cochrane Collaboration, internationally acknowledged as the gold standard in evidenced based reviews of health science, confirms doubts over the benefits of fluoridating water supplies in modern developed countries like New Zealand.

The Cochrane Review finds the science does not support claims that water fluoridation is of any benefit to adults, nor that it reduces social inequalities, nor that it provides additional benefits over and above topically applied fluoride (such as in toothpaste), nor that tooth decay increases in communities when fluoridation is stopped.

These are all arguments used by our health department in promoting the procedure.

The review is not convinced that studies showing that water fluoridation reduces decay in children are applicable to today’s society either, as nearly all the studies used in calculations (dating back to the 1940’s) were conducted prior to the availability of fluoride toothpaste and other sources of fluoride which we have today, and were at high risk of bias.

These findings are completely at odds with last year’s Royal Society review , which our government refers to as justification for promoting  fluoridation.

The Cochrane Review was not charged with investigating the health risks of water fluoridation, other than the harmful effects on teeth.

Here it found that 40% of children in fluoridated areas have dental fluorosis, developmental damage to the tooth structure caused by fluoride overdose.

Fluoride has been shown to affect brain development and thyroid function in low doses, and was classified as an endocrine disruptor by the landmark review on health effects of fluoride by the top scientific body in the U.S., the National Research Council (published in 2006).

It is of concern that while fluoridation promoters proclaim the science is settled, and base their policies on unreliable studies, the  properly conducted gold standard systematic reviews stress the need  for better research to be done.

The Cochrane Review findings support statements previously made by FIND, an independent dentist group looking at fluoridation in New Zealand, and reinforce their call for a national moratorium on water fluoridation, and an independent investigation into the policy in this country.

“It’s important to consider what the implications could be of a health department allowing such a policy to continue when it is not backed by the weight of scientific evidence” says FIND spokesman, Dr. Stan Litras.

Source: Fluoride Action Network.


One California drought winner? The local car wash.

by Lauren Sommer

Editor’s Note.  How Drought Affects Businesses.  The California drought has had a devastating effect on some businesses.  Pool, contractors,  for example.  Although in the long term, a backyard pool probably usually uses less water than a conventional lawn, in the short term it’s hard to justify filling a large pool that could be better used for drinking and general household purposes. (See “A California drought loser: Pool Contractors.” )  One business that’s done well, however, is the local car wash.–Hardly Waite.


It’s gotten a lot tougher for Californians to ignore the state’s drought. Mandatory water restrictions have kicked in, aiming to cut use by an average of 25 percent statewide. To meet those cuts, water utilities are imposing new rules about what Californians can and can’t do with water. Some industries are enjoying a boost in business as a result.

“I’m sure in summer we’ll see an influx in business, which is great,” says Jeff Wheeler of AJ Auto Detailing in San Jose, where his crew was pressure-washing a row of cars.

Just a month ago, the San Jose City Council passed drought rules that most car washing businesses could only dream of: if you live in San Jose, you’re no longer allowed to wash your car at home with potable water. Commercial car washes are okay, because most recycle water.

“A customer came in the other day and he brought his truck,” says Jeff’s brother, Jordan Wheeler. “He has a big yard and he has tractors and stuff, and he says he was washing off a couple of his tractors and a neighbor complained and called the police on him.”

Washing cars at home is still allowed by most California water agencies, if residents have a shutoff nozzle on their hose. But San Jose has banned it with or without a nozzle because the city is aiming to cut water use by 30 percent.

Jeff Wheeler says his carwash has an added selling point: it’s extra water efficient.

“How this all starts is, there’s multiple pumps,” Wheeler says, pointing to his water recycling system. Water flowing off the cars is recaptured, filtered and put into large tanks. Each gallon is reused four to five times, which saves a lot of water.

“We’re actually only using about 2 to 2.5 gallons per car and that’s less than a dishwasher uses,” Wheeler says.

That saves as much as 100 gallons over what a home car wash uses, but overall, it’s a drop in the bucket compared to what lawns need — so why single out car washing?

“As agencies are trying to meet some of the restrictions, in some cases up to 36 percent, they’re going to have to cut a lot of things,” says Heather Cooley of the Pacific Institute, a water think tank in Oakland. “And so every bit is going to help.”

On the other hand, water districts that have already cutback have been given lower conservation targets by the state, down to eight percent. In those areas, some drought rules are in place to simply get the public’s attention, like the one that prevents restaurants from serving water unless customers ask for it.

“It’s showing people that we are in a drought,” Cooley says. “That we need to be thinking about all the different ways we use water.”

By making everyday Californians feel the pain, he says, they’re more likely to step up and make lasting changes, like putting in drought-friendly landscaping.

“In every city, lawns are sort of standard when a new area is put in, when a street median is put in,” she says. “And so that has to change and this drought, I think, is really going to drive that change.”

More permanent changes will pay off by saving water during the next drought — which Cooley says are definitely in California’s future.

Source: Marketplace.

Common Protozoa that Infect Drinking Water and How to Get Rid of Them

by Gazette Technical Wizard Pure Water Annie

The the most common protozoa that affect drinking water quality in the United States are Cryptospridium and Giardia.  Both are intestinal parasites of warm-blooded animals.  There are several species of each, and some can infect humans.  Infection can come from recreational waters, drinking water, or food.

According to one authority, “Infection requires ingestion of about one to 10 organisms. Some infections are asymptomatic, so some people are not aware they are infected. Symptoms can include diarrhea and sometimes nausea, vomiting and fever. The infections are usually self-limiting, lasting several days for healthy people, but they can be chronic or fatal for less healthy or immunocompromised people.”

Both Cryptosporidium and Giardia thrive in cold water, but Crypto cysts are sensitive to higher water temperature and can survive only about a week in 85 degree F. water.  Both cysts are much more resistant to the usual water disinfectants than bacteria, and Cryptosporidium is virtually unaffected by regular municipal chlorination.  Ozone and ultraviolet treatment are very effective for both, and because both cysts are relatively large, tight filtration devices like ultrafiltration,  microfiltration, nanofiltration, and reverse osmosis easily remove them.  In fact, a common treatment for both is conventional filtration in the two-micron range and tighter.

In a word, both cysts are fairly easily eliminated by point of use treatment like tight undersink filters and reverse osmosis and point of entry treatment by ultraviolet, but regular city water disinfection with chlorine and chloramine cannot be relied upon.

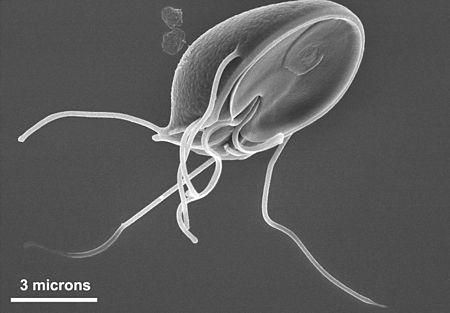
 The size of the Giardia pictured above shows that the cysts are easily controlled by tight filtration devices like reverse osmosis and even conventional 1-micron filters.


More about Giardia.

More about Cryptosporidium.


Rivers, lakes loaded with artificial sweeteners

It may be lurking in your diet soda, your chewing gum and even in your favourite yogurt. Now scientists have found artificial sweeteners are also coming out of your faucet. Sweeteners are used in thousands of food and beverages sold around the world, according to The Sugar Association. And on World Oceans Day, marked every June 8, scientists are asking us to consider where sweeteners end up after they’re ingested. According to recent research, scientists have found artificial sweeteners in bodies of water around the world, including Canada.

Sugar substitutes — such as Splenda and Sweet’N Low — are designed to be eaten, but not absorbed by the body. Because our bodies cannot break them down, sweeteners go straight through humans.

That’s how consumers get the sweet taste without the weight gain often associated with sugar-laden foods.

Once the sweetener leaves the body, wastewater treatment plants face the same dilemma: studies have found they can’t break down the complex chemical. Most sweeteners, then, flow into oceans, lakes and rivers in practically the same form in which they were consumed.

It’s a situation playing out in the water flowing through southwestern Ontario’s Grand River, which empties into Lake Erie. Researchers from the University of Waterloo and Environment Canada found the amount of sugar substitute in the water is equivalent to about 81,000 to 190,000 cans of artificially sweetened soda flowing through the 300-kilometre river each day.

The study tested for sucralose, cyclamate, saccharin and acesulfame. It also found three types of sweetener coming out of the faucets in Brantford.

Sweeteners could harm aquatic life

According to the Canadian study, the effect of artificial sweeteners in the water is largely unknown. But Amy Parente, an assistant professor of biochemistry at Mercyhurst University in Erie, Penn., says scientists should be on alert.

Parente did her own study in Lake Erie looking for sucralose, the substitute used by Splenda. Her team also found the sweetener in the water. But while other studies took samples from what came out of wastewater treatment plants, Parente tested water found at the lake’s beaches, where the sweeteners had a chance to dilute.

She and her team found 0.15 micrograms of the sweetener for every litre of water, which meant there could be up to 72 metric tons of sweetener floating in the waters of Lake Erie.

Since Parente’s study came out in 2012, Parente and her students have been looking at how sweetener affects a snail living in Lake Erie that forages for food. As part of that work, one student found the presence of sweetener made the animals believe there was nutrition in the water.

The team believes the sweetener affected their foraging abilities, leaving them with fewer calories to be healthy and reproduce. And Parente thinks this could be true for other foraging animals.

“When people think about small animals and small organisms, they tend not to be concerned,” Parente said in a phone interview with CTVNews.ca. But she added the impact has the potential for a domino effect.

Another study published by Environmental Science and Technology also found large amounts of sucralose, saccharin, aspartame and acesulfame near wastewater treatment plants in New York State. The study suggested sweetener can harm a plant’s ability to perform photosynthesis.

This could create less food for animals that depend on the plants, creating a ripple effect that could make its way back to humans.

The taste is not in the tap

For now, more research is needed before drawing any conclusions about sweeteners’ impact on all aquatic life, said Environment Canada research scientist, John Spoelstra, part of the team that tested the Grand River.

And while research shows a large amount of sugar substitutes in our bodies of water, Spoelstra said consumers shouldn’t expect their drinking water to taste any sweeter.

“Concentrations in the river are very small,” Spoelstra told CTVNews.ca. “They’re in the tens to hundreds of thousands of times lower than the concentration that would be in a can of soda.”

As for aquatic life, scientists have had less than a decade to study the effect of the sweeteners, since research showing its concentration only came out a few years ago, Spoelstra said. But work is underway by scientists around the world.

The few studies that have come out shouldn’t be ignored, Parente said, likening them to the canary in the coal mine.

“I feel that out of these small organisms are early warnings,” she said. “We need to heed those warnings.”


Source:  CTV News.

Pure Water Gazette Fair Use Statement

B. Sharper, the Pure Water Gazette’s numerical wizard, puts out some facts about our oceans on World Oceans Day.

June 2015 date on which World Oceans Day was celebrated — 8.

Percentage of the Earth’s surface that is covered in water — 70+.

Percentage of this water that is in our oceans — 97%.

Pounds of plastics that we dump into our oceans each year — 19,000,000,000.  (Nineteen billion.)

Number of feet that sea levels are expected to rise during this century –3.3.

Degrees Fahrenheit that sea surface temperatures rose over the past century — 0.18.

Percentage of the oceans’ fish stocks that are now considered to be overfished — 60%.

Jobs that were lost when one species of cod was overfished in 1992– 40,000.

At current rate of overfishing, according to some scientists, the date at which it is expected that we will simply run out of fish — 2055.

Percentage of marine predators that have already been removed from their habitats — 90%.

Percentage of Caribbean coral reefs that were damaged due to “coral bleaching” — 50%.

Percentage of the marine life that lives in coral reefs. — 25%.

Percentage of our carbon dioxide emissions that end up in the ocean — 30%.

Percentage of the oceans that have actually been explored by humans –less than 10%.


Source of Numerical Facts.

How Much Water?


Posted June 7th, 2015

How Much Water Should Humans Drink?

 Gazette’s Introductory Note:  Although asking how much water we should drink is in a way like asking how much air we should breath, since our intake of both of life’s essentials is mainly self-regulating,  almost everyone who writes about health and nutrition has at some time chimed in on the topic of how much water a person should drink.  Although we know of no one who believes in drinking zero water, quantity advice ranges from not much to gallons per day. The Gazette has consistently stuck with the radical “drink water when you’re thirsty” theory. Below is a view on the subject from a technical journal focused on water treatment.  It is excerpted from a piece by Dr. Joseph Cotruvo.
The statement, “Water is life,” is not an exaggeration. All living plants and animals require regular and sufficient water consumption for survival, as well as for growth and development. Serious and even fatal outcomes can occur under extreme conditions of either seriously inadequate or very excessive water intake, and there might be some health benefits associated with consumption beyond the averages. Water is also a common element in Christian, Muslim and Jewish religious writings.

Daily water consumption occurs from several sources: Tap water, beverages and foods made with tap water, bottled water, bottled beverages and metabolic water that is produced from ingested food and its conversion to energy. The first four are obvious. The fifth, metabolic water, is created by living organisms through metabolism by digesting and oxidizing energy-containing substances in their food. Metabolism produces about 110 grams of water per 100 grams of fat, 41.3 grams of water per 100 grams of protein and 55 grams of water per 100 grams of starch. So, it adds a few hundred milliliters to our daily water intake.


How much water should we drink?

Ingested water serves many functions. It is essential for maintaining blood composition, salts balance and cellular osmotic pressure, and it aids digestion, helps eliminate wastes in urine and feces, provides a solvent/solute load for the kidneys and helps control body temperature through perspiration. It usually contains salts and some nutrients like calcium, magnesium, chloride, sulfate, sodium and potassium; and, uptake of essential minerals is often more efficient from water than from foods. Calcium and magnesium uptake from water and milk is in the range of 50 to 60 percent versus approximately 15 to 20 percent from foods.

It is important to consume water regularly, especially during physical stress conditions. I recall when coaches would not allow athletes to consume water during practice and games, ostensibly to prevent vomiting. Nowadays, we see them drinking constantly. Acute dehydration has immediate, measurable and adverse consequences. Fluid loss of one percent stimulates thirst and impairs thermoregulation. Vague discomfort and loss of appetite appears at two percent. Dry mouth appears at about three percent loss. At four percent loss, work capacity decreases by 20 to 30 percent. Headaches and sleepiness occur at about five percent loss. Collapse can occur at about seven percent, and a 10 percent loss is life-threatening.

Water intake is needed at a minimum to replace losses and prevent dehydration. Water is lost through urine, feces, respiration and evaporation. Young children, pregnant and lactating women, the elderly, heavy work and exercisers and persons with certain diseases have increased fluid requirements compared to the general sedentary population. Numerous studies have attempted to determine water needs, but in 1989 the National Research Council (NRC) concluded that because of the complexities, a Recommended Dietary Allowance (RDA) could not be established, but an Adequate Intake (AI) reference value was provided for healthy Canadian and American populations.

Water needs under conditions of physical stress, high temperature and humidity are substantial. Physically active individuals might sweat at the rate of three to four liters per hour under those conditions. Daily fluid requirements have been shown to range from as little as two liters per day to 16 liters per day. Several national military organizations have conducted studies of the water needs of troops under stressed survival and endurance requirements. A study of members of the Zimbabwe National Army doing strenuous work over 12 days showed that consumption of the test group was 11 liters per day versus seven liters per day in the control group.

The U.S. Army revised its water replacement guidelines to 0.5 liters per hour for an easy work rest cycle at 78o to 81.9o F to at least one liter per hour for a hard work/rest cycle of 10/50 minutes at > 90o F. The revision occurred after 190 military personnel were hospitalized over several years for hyponatremia (excess, unreplaced sodium loss by perspiration), which can be fatal when excessively large volumes of plain water were consumed in combination with a low sodium chloride diet.

Gender and age specific AIs were established by the NRC in 2004 (See Table 1).


Table 1

Age AI (l/day)
Zero to six months 0.7 assumed from human milk
Seven to 12 months 0.8 milk plus food and beverages
One to three years 1.3
Three to eight years 1.7
Nine to 13 years 2.4 boys, 2.1 girls
14 to 18 years 3.3 boys, 2.3 girls
19 to 70+ 3.7 men, 2.7 women


The values in Table 1 are applicable under typical, nonstressed conditions. For higher stress situations (e.g., athletes), the amount of water ingested should equal the amount lost, i.e., 1 kg of lost weight = 1 kg of water consumption. Alcohol has a known transient diuretic effect, but adequate fluid intake immediately following alcohol consumption will not result in appreciable fluid losses over a 24-hour period.

The World Health Organization’s (WHO) requirements in liters per day for adults are listed in Table 2.

Table 2

Sedentary, temperate env. Physically active/increased temperature
Female adult 2.2 4.5
Male adult 2.9 4.5 – 11.0


How much water is actually consumed by U.S. citizens?

Regulatory agencies establish regulations for contaminants in water partly based upon assumed values for daily human tap water consumption. Precise determinations of actual consumption vary by individuals and conditions; so to simplify the regulatory decision, the U.S. Environmental Protection Agency (EPA) assumes lifetime consumption of two liters per day for a 70 kg adult, and one liter per day for a 10 kg child. WHO assumes two liters per day for a 60 kg adult and one liter per day for a 10 kg child. Canada assumes 1.5 liter per day for a 70 kg adult.

Several large-scale surveys have produced data on consumption of community water and/or total water by individuals and groups. Results tend to be in similar ranges given the margins of variability in these types of studies (e.g., Kahn; and Kahn and Stralka, 2008). For example, a 1989 report by Ershow and Cantor, using survey data for three consecutive days from 1977-78, concluded that the mean value for tap water consumption was 1.193 liters per person per day, and 88 percent consumed two liters per day or less. A more recent analysis of a survey for two, nonconsecutive days from 1994-96 (EPA, 2000) of 15,303 persons gave 0.927 liters per person per day as the average per capita ingestion of tap water. The estimated 90th percentile consumption was 2.016 liters per day (range 1.991 to 2.047). Some people reported drinking no tap water, so results for 14,012 “consumers only” were 1.0 liters per day (0.976 to 1.024) as the mean, and the 90th percentile value was 2.069 liters per day.

Values for “total water consumption” for “consumers only” were 1.241 liters per day (1.208 to 1.274) as the mean, and the estimated 90th and 95th percentiles were 2.345 and 2.922 liters per day, respectively. So, 83 percent of consumers only consumed two liters of water per day or less.

The average reported consumption for bottled water drinkers was 0.737 liters per day; the 90th and 95th percentile estimates were 1.568 liters per day and 1.971 liters per day.

The total water consumption average for all individuals was 1.232 liters per day, and the 90th and 95th percentiles were 2.341 and 2.908 liters per day. In this study, approximately 84 percent of the U.S. population consumed two liters or less per day. About 13 percent of the U.S. population water consumption in those studies was attributable to bottled water and 10 percent to other sources.

For children between one and 10 years old, the mean total water consumption was 0.528 liters per day, and the 90th and 95th values for total ingestion were 1.001 and 1.242 liters per day. Thus, 90 percent of children consume one liter of water per day or less.
 

Are there health benefits from greater water consumption?

Although it is difficult to precisely determine desirable and ideal water consumption levels, there are reports that people with greater water consumption may benefit more compared to those with less. Dehydration has been linked to increases in risks of urinary tract infections, dental disease, constipation, kidney stones and impaired cognitive function. Higher fluid intakes have been associated with reduced risks of urinary tract stones, colon and urinary tract cancer, and mitral valve prolapse in some studies. More research is necessary on this appealing hypothesis.


Conclusions: How do these approximate values compare to AIs and regulatory default assumptions?

It is clear that the actual water consumption in the U.S. is below the recommended AI values for almost every age group. Some additional water is provided by metabolism and nontap water sources, but the AI values would not likely be exceeded in many cases except perhaps for active high consumers.

Regarding the default water consumption values of two liters per day for adults and one liter per day for a 10 kg child, approximately 90 percent of adults are consuming two liters per day of tap water or less, and almost all very young children are consuming about one liter of tap water per day or less. So, water consumption levels indicate that drinking water standards are generally protective of the population and have greater margins of safety for essentially all very young children and virtually all adults. Additional conservatism is embedded in calculations of drinking water standards by inclusion of relative source contribution factors attributable to drinking water as a source. The usual default value is 20 percent which results in additional safety.

There are several studies indicating potential health benefits from long-term consumption of greater amounts of water, which is worth exploring further.

So, today’s take-home message is: More water and a little more salt is good for people with more strenuous activity. And, the good news is that community tap water in the U.S. is safe almost everywhere.


Article source: Water Technology.