“Taking a sledgehammer to the Clean Water Act”

cuyahogriverussteel1965

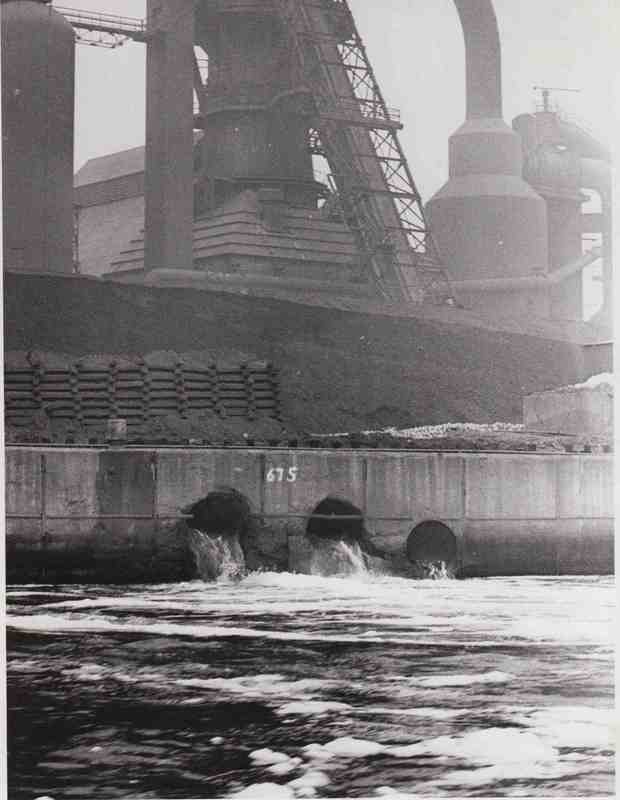
Cleveland’s Cuyahoga River before the Clean Water Act. The Cuyahoga was so chemical-laden that it caught on fire several times.

The Trump administration will formally start the process of lifting federal Clean Water Act protections for millions of acres of wetlands and thousands of miles of streams across the U.S., undoing decades of protections against pesticide runoff, industrial waste, and other pollutants. The proposed rules, to be unveiled by the Environmental Protection Agency in December, 2018, are a victory for agricultural and real estate interests but are likely to degrade the drinking water used by tens of millions of Americans and endanger fisheries and the habitats of migratory birds and other species.

President Trump promised during his campaign to roll back the Obama-era Waters of the United States rules, an expansion of federal protections under the the Clean Water Act of 1972, but the new Trump proposals target protections dating back to the George H.W. Bush administration or earlier. The Trump rules, which will be subject to 60 days of public comment, will keep protections for larger bodies of water but remove federal safeguards for wetlands not adjacent to navigable waterways plus most seasonal streams and ponds. The newly vulnerable streams provided drinking water for as many as 1 in 3 Americans, especially in the arid West, according to scientific studies used by the Obama-era EPA. And when small streams are polluted, they feed into larger streams and lakes, affecting the quality of drinking water for the entire nation.

The Trump EPA calls that data incomplete and will argue that it is tackling an Obama-era federal power grab against rural farmers. Trump’s promise to end the Waters of the United States policy was cheered by farmers, real estate developers, golf course owners, and mining and oil firm. Environmental groups call the new proposal a disaster. “It is hard to overstate the impact of this,” Blan Holman, managing attorney at the Southern Environmental Law Center, told the Los Angeles Times. “This would be taking a sledgehammer to the Clean Water Act and rolling things back to a place we haven’t been since it was passed. It is a huge threat to water quality across the country, and especially in the West.”

Adapted from: The Week.

Reference: Trump proposes to roll back decades of water protections” from Politico.

cementriverinwinter

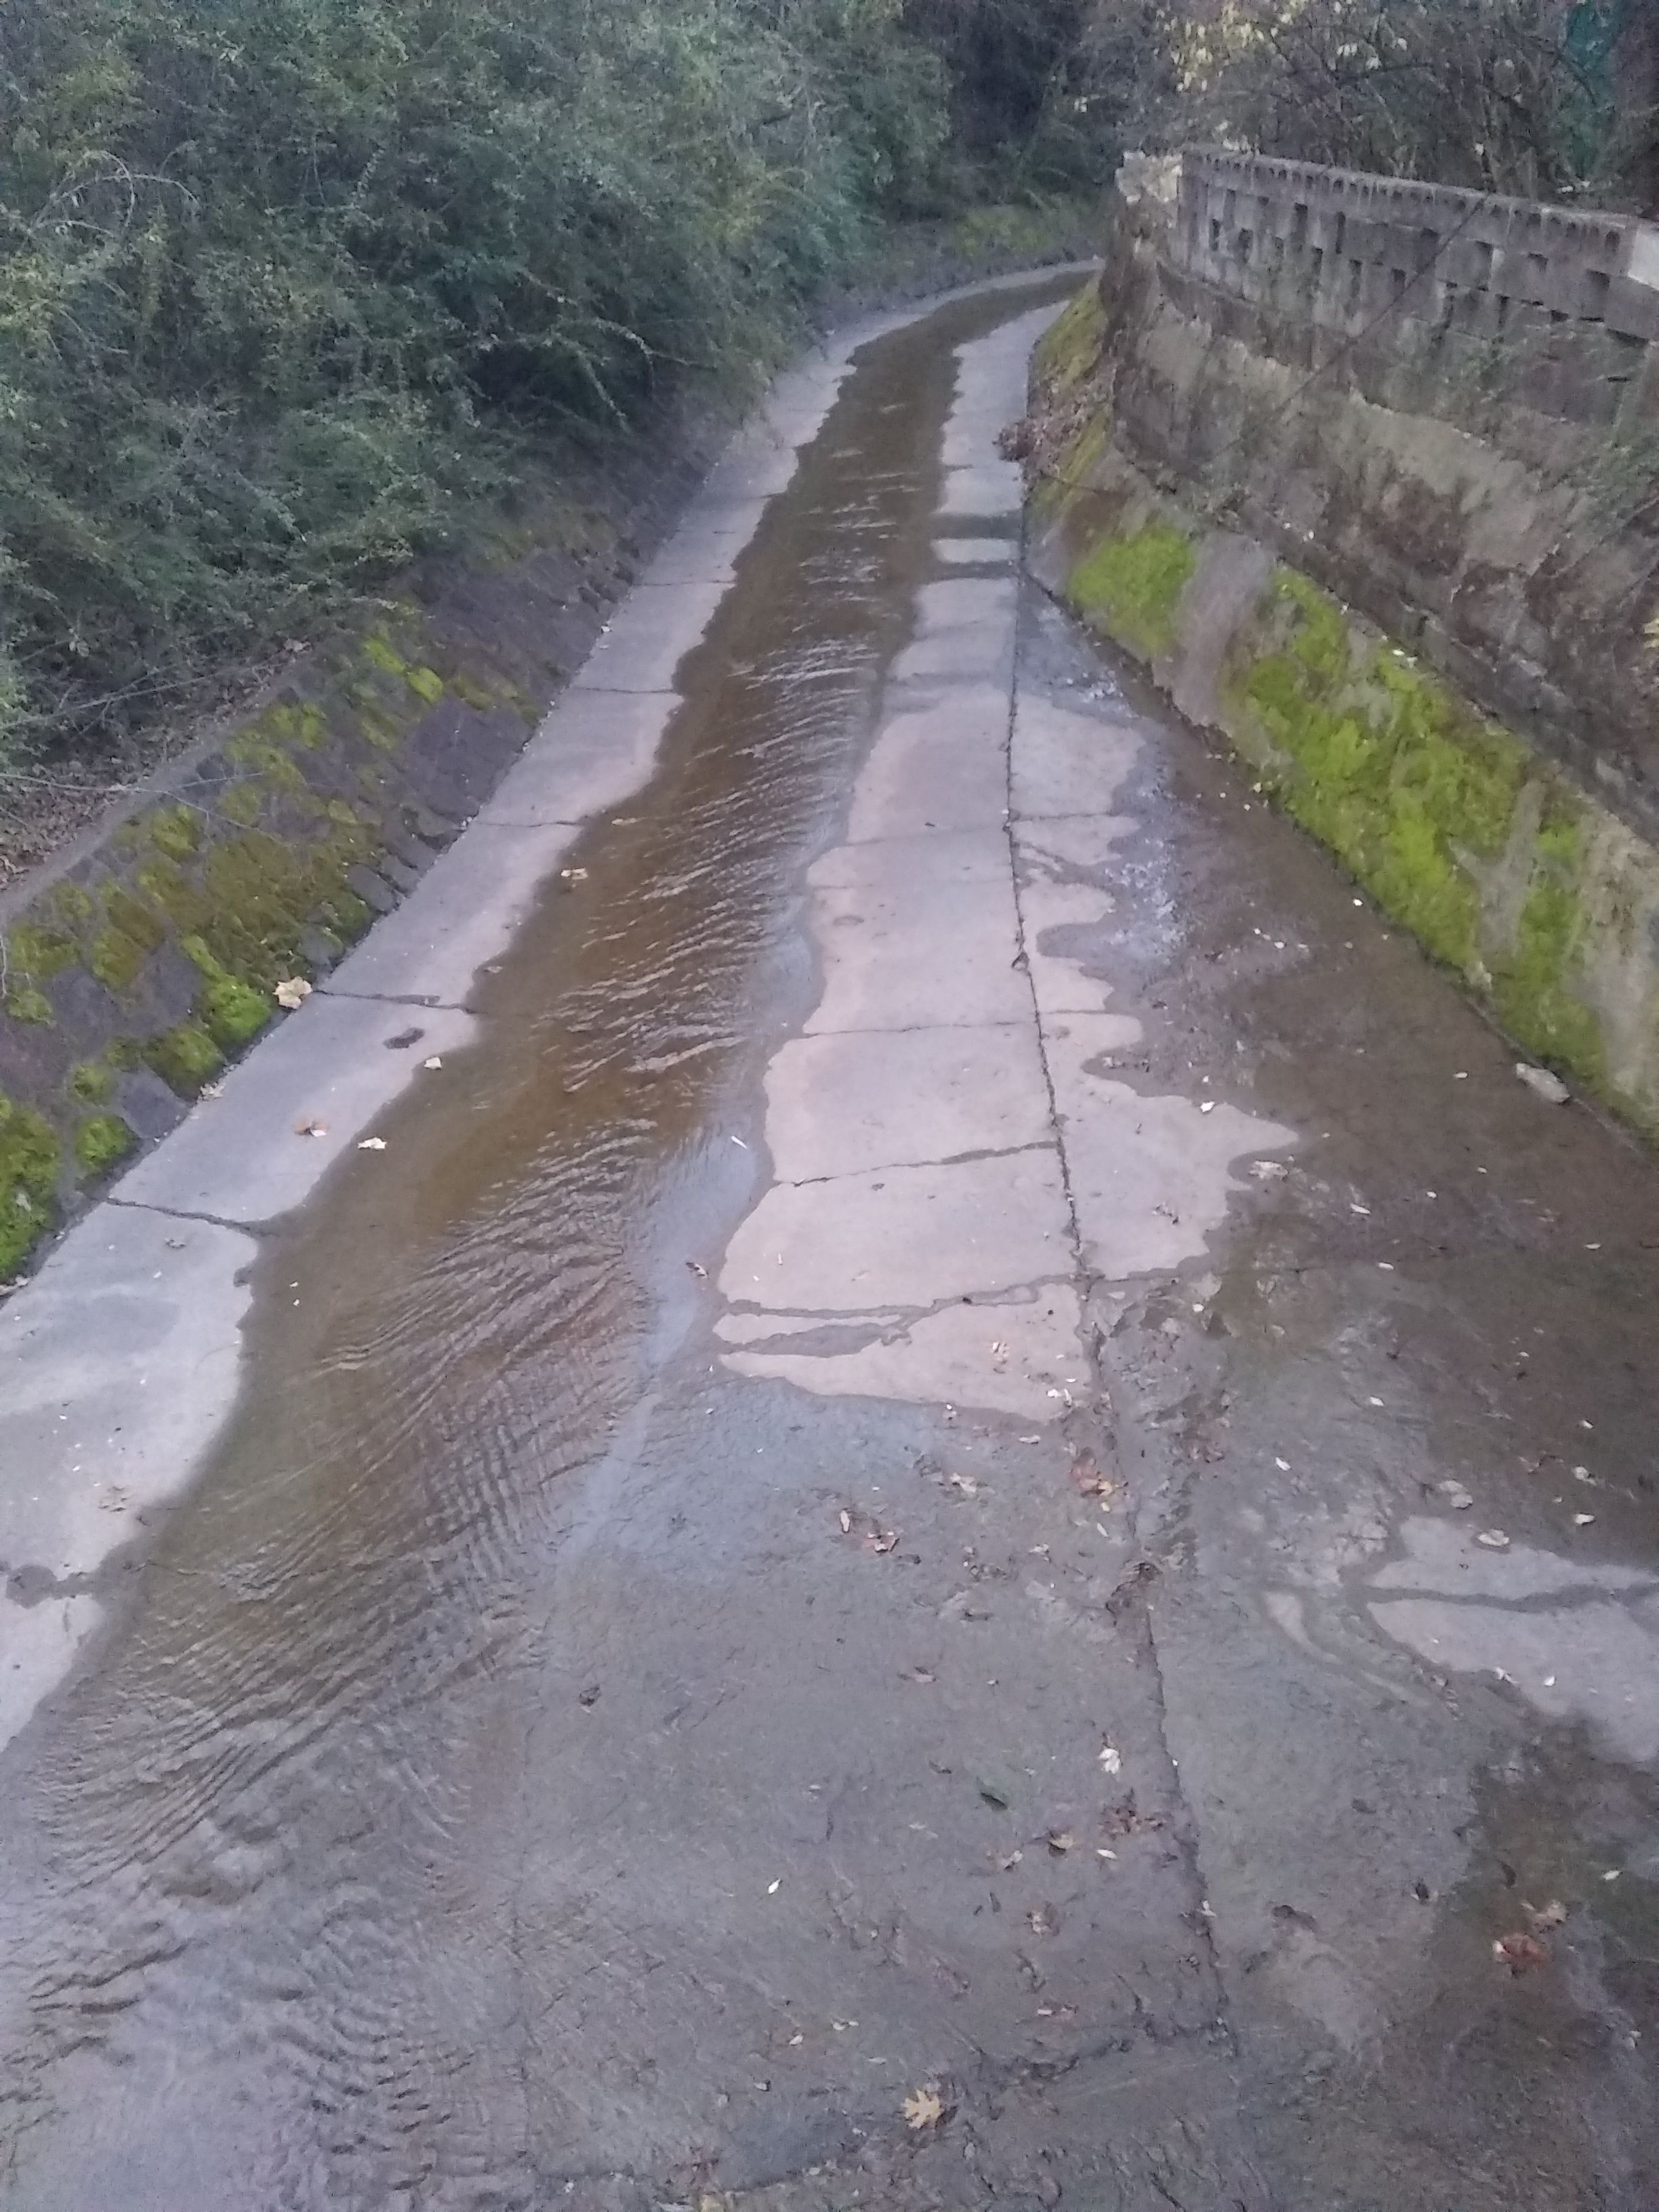
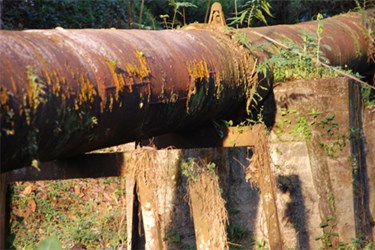
We call this picture “Cement River in Winter Viewed from the Bolivar Street Bridge”.  It features one of the “season streams” that are no longer protected by the Waters of the United States rules. All water is connected. When you pour motor oil into the Cement River, it eventually makes its way into somone’s drinking water reservoir.

The Fourth National Climate Assessment: What It Says About Water and Climate Change

The US Government’s Fourth National Climate Assessment, issued in the fall of 2018, devotes a long chapter to the effects of climate change on the nation’s water. Below are excerpts from the chapter which highlight its  important features.

National Climate Assessment: Highlights from the Water Chapter

by Emily McBroom

Rising air and water temperatures and changes in precipitation are intensifying droughts, increasing heavy downpours, reducing snowpack, and causing declines in surface water quality, with varying impacts across regions. Future warming will add to the stress on water supplies and adversely impact the availability of water in parts of the United States.

Changes in the relative amounts and timing of snow and rainfall are leading to mismatches between water availability and needs in some regions, posing threats to, for example, the future reliability of hydropower production in the Southwest and the Northwest. Most U.S. power plants rely on a steady supply of water for cooling, and operations are expected to be affected by changes in water availability and temperature increases.

Groundwater depletion is exacerbating drought risk in many parts of the United States, particularly in the Southwest and Southern Great Plains.

Dependable and safe water supplies for U.S. Caribbean, Hawaii, and U.S.-Affiliated Pacific Island communities are threatened by drought, flooding, and saltwater contamination due to sea level rise.

Aging and deteriorating water infrastructure, typically designed for past environmental conditions, compounds the climate risk faced by society. Water management strategies that account for changing climate conditions can help reduce present and future risks to water security, but implementation of such practices remains limited.


Changes in Water Quantity and Quality

Changes in climate and hydrology have direct and cascading effects on water quality. Anticipated effects include warming water temperatures in all U.S. regions, which affect ecosystem health, and locally variable changes in precipitation and runoff, which affect pollutant transport into and within water bodies.

These changes pose challenges related to the cost and implications of water treatment, and they present a risk to water supplies, public health, and aquatic ecosystems.

Increases in high flow events can increase the delivery of sediment, nutrients, and microbial pathogens to streams, lakes, and estuaries; decreases in low flow volume (such as in the summer) and during periods of drought can impact aquatic life through exposure to high water temperatures and reduced dissolved oxygen.

The risk of harmful algal blooms could increase due to an expanded seasonal window of warm water temperatures and the potential for episodic increases in nutrient loading.

In coastal areas, saltwater intrusion into coastal rivers and aquifers can be exacerbated by sea level rise (or relative sea level rise related to vertical land movement), storm surges, and altered freshwater runoff. Saltwater intrusion could threaten drinking water supplies, infrastructure, and coastal and estuarine ecosystems).

Indirect impacts on water quality are also possible in response to an increased frequency of forest pest/disease outbreaks, wildfire, and other terrestrial ecosystem changes; land-use changes (for example, agricultural and urban) and water management infrastructure also interact with climate change to impact water quality.


Deteriorating Water Infrastructure at Risk

Capital improvement needs for public water systems (which provide safe drinking water) have been estimated at $384 billion for projects necessary from 2011 through 2030. Similarly, capital investment needs for publicly owned wastewater conveyance and treatment facilities, combined sewer overflow correction, and storm water management to address water quality or water quality-related public health problems have been estimated at $271 billion over a 20-year period. To date, however, there is no comprehensive assessment of the climate-related vulnerability of U.S. water infrastructure, and climate risks to existing infrastructure systems remain unquantified.

Compound extremes, such as terrestrial flooding and ocean flooding occuring at the same time, can also increase the risk of cascading infrastructure failure since some infrastructure systems rely on others, and the failure of one system can lead to the failure of interconnected systems, such as water–energy infrastructure.

Water Management in a Changing Future

Paleoclimate analyses and climate projections suggest persistent droughts and wet periods over the continental United States that are longer, cover more area, and are more intense than what was experienced in the 20th century.

The challenge is both scientific, in terms of developing and evaluating these approaches, and institutional–political, in terms of updating the regulatory, legal and institutional structures that constrain innovation in water management, planning, and infrastructure design.

Source: The Fourth National Climate Assessment: Chapter Three.


What Carbon Treats and What It Doesn’t

filtercarbon

Filter carbon is the most widely used treatment for water problems, the most commonly used filter medium.  It works for a broad range of applications, but as the chart below shows, it doesn’t do everything. The comments are generalizations. Some carbons work better for specific applications.

Filter carbon can be made from a variety of raw materials, processed in a variety of ways, and delivered in a variety of formats.

Is Carbon a good treatment for …? Answer Comment
VOCs Yes This is what coconut shell carbon is best at.
Organics Yes Best and often the only treatment.
Pesticides Yes Best and often the only treatment.
Herbicides Yes Best and often the only treatment.
Bacteria No, with qualifications. Carbon is not a recognized treatment for bacteria, although carbon blocks can be made so tight that they screen out bacteria. Silver impregnated carbon is marketed as “bacteriostatic.” This does not mean that it purifies non-potable water but that the added silver can inhibit the growth of bacteria in the carbon bed. (The same is true for KDF, which is said to have “bacteriostatic” properties.)
Cysts (Giardia and Cryptosporidium) No, with qualifications. However, many carbon block filters have cyst certification because they are tight enough to screen out cysts effectively.
Inorganics No, except mercury. Carbon block filters, however, are often engineered to remove lead by the adding a lead removal resin to the carbon. Arsenic reduction media can also be added to carbon filters.
Radionuclides No, with qualification. This is a difficult classification. According to the EPA, “Approximately 2,300 nuclides have been identified; most of them are radioactive.” The two most frequently at issue in water treatment, Radon and Uranium, are included separately in this listing.
Radon Yes Aeration is usually preferred to carbon filtration because the spent carbon itself becomes hazardous waste.
Hydrogen Sulfide (Rotten Egg Odor) Yes, with qualifications. Lifespan of carbon can be limited if the H2S is not pretreated with an oxidizer. Catalytic carbon is superior to standard for H2S treatment.
Iron Yes, with qualification. Backwashing standard carbon filters remove pre-oxidized iron. Catalytic carbon can remove small amounts of iron without pretreatment if conditions like pH are right.
pH correction No, with qualification. Almost anything done to water affects pH, but carbon is not used to raise or lower pH.Sometimes new carbon makes a radical change in the water’s pH, but this effect usually goes away with time.
Calcium and Magnesium (hardness) No Only water softeners (ion exchange), reverse osmosis, and distillers actually remove hardness.
Sodium No Only ion exchange, reverse osmosis, and distillers actually remove sodium.
Nitrates No Only reverse osmosis, distillers, and anion exchangers affect nitrates.
Fluoride No, with qualifications. Carbon sometimes removes fluoride, but it is not a reliable fluoride treatment. A specialty carbon made with animal bones (Bone Char) is used in some parts of the world to remove fluoride.
Taste and Odor Yes Carbon is the unchallenged best treatment for most taste/odor problems. Carbon filtration improves the taste of most waters.
Color Yes, with qualifications. Macropore carbon (the best is made of Eucalyptus and currently hard to find) is an effective treatment for tannins. Lignite based carbon is also used for tannins. Standard carbon may help.
TDS (Total Dissolved Solids) No Carbon does not reduce dissolved minerals. In fact, carbon filtration may add slightly to the TDS reading.
Arsenic No Only when accompanied by arsenic reduction resins.
Chromium No
MTBE (gasoline additive) Yes Coconut shell carbon is preferred.
Chloramines Yes Much longer contact time is needed for chloramine than for chlorine. Catalytic carbon is superior to standard carbon for chloramine reduction.
Uranium No
Chlorine Yes Carbon converts chlorine to harmless chloride. This is what carbon is bes
PFAS Yes, with qualification. Carbon has been found to be effective at reducing chemicals in the PFAS classification, but many chemicals are involved so generalization is tricky. This is definitely a “more studies are needed” situation.
Ammonia No In fact, when chloramine is treated with carbon, ammonia in the water is increased.


carbon pores illustration

carbon pores illustration

How Caffeine Is Stripped from Coffee by Use of the Chemical-Free Water Method

cupofcoffee

Caffeine is in the coffee bean for a reason.  It’s a natural alkaloid that serves the coffee plant as a pesticide.  It paralyzes bugs that invade the plant and also gives off a bitter flavor as a warning of its toxic nature.

Caffeine is water soluble, as are most of the other ingredients of the bean that give coffee its flavor.

The art of decaffeination,  therefore, consists of stripping the caffeine from the coffee bean while leaving behind the desirable ingredients that provide the coffee taste and aroma.

Several methods are used to remove caffeine from coffee.  Many involve chemicals, but others rely almost entirely on water.  The water methods are definitely the more desirable.  The so-called Swiss Method is considered the standard of excellence.  Here’s how the process is described:

The green, or unroasted coffee is fully submerged in filtered water that has been heated, in order to extract all the soluble material from the beans. The water solution is then filtered through carbon to separate the caffeine compounds from any of the aromatics that also came out during the extraction, and the coffee beans are then placed in an immersion tank with the caffeine-free solution, allowing them to reabsorb everything but the jitters.

World standards differ on the definition of “decaffeinated coffee,”  some allowing 97% caffeine reduction, but the highest  standards require elimination of  as much as 99.9% of the alkaloid content of coffee in order to display the decaffeinated label.

Reference:

Serious Eats Website

Pure Water Gazette:  What Kind of Water Makes the Best-Tasting Coffee


America’s Dirty Little Secret

agingwaterpipe

Water Online writer Sara Jerome, in her article “Small Town, Big Water Problems,” says that in the small Louisiana community of Enterprise, the tap water is so bad that “one woman drives 20 miles each way to do her laundry in another town.” The water situation in Enterprise illustrates a festering problem in the United States: Funding for infrastructure repairs and upgrades in small communities is hard to come by.

Jerome continues:

“Years of water system neglect means that the 250-or-so residents there are left with pipes that leak more than 70 percent of their water into the ground — all because they can’t afford to fix them,” CNN reported, citing John Tiser, resident and water board president.

But Enterprise is hardly alone.

“The EPA estimates $132.3B is needed to repair small water systems in America over the next 20 years. But, in 2017, only $805.7M was allocated to these systems — about 12 percent of the amount needed,” CNN reported.

Virginia Tech Engineering Professor and water expert Marc Edwards refers to it as America’s “dirty little secret.” He explains that oftentimes towns like Enterprise are stuck with aging infrastructure that they can’t fix, leaving few options for them to deal with complaints about dirty or contaminated water. Edwards received a nearly $2M grant to uncover water issues in towns like this.

When Edwards and a scientific team tested Enterprise’s water in 2017, they found bacteria, lead and other contaminants that exceeded EPA limits.

“The whole idea is, at the end of this, to come up with a model to predict which cities are likely to have problems,” Edwards said. “Which cities are most likely to have lead pipes, and not be following the rules, and then work with communities there to figure out if they do have a problem, then build algorithms for individual homeowners to protect themselves, from sampling to filters.”

It is important to point out that while “over 92 percent of U.S. residents who receive water from community water systems are supplied by water that meets health-based standards at all times,” the U.S. EPA estimates that over $743B is needed for water infrastructure improvements.

To illustrate the extent of the water problems that plague small U. S. systems, here are more Water Online articles:

Texas Town Confronts Brown Water Coming From Taps. Residents of River Oaks, TX, are tired of drinking brown tap water.

Study Finds That Millions Of Americans Get Water From PFAS-Laced Sources. The level of perfluoroalkyl substances (PFASs) in drinking water sources exceeds federal safety limits in supplies serving millions of U.S. residents.

Authorities Target Water Operator Over Lead Crisis In Ohio. Ohio authorities filed charges against a water operator last week, alleging that he failed to alert residents about lead levels in the village of Sebring, where tainted tap water has triggered elevated lead levels in children.

18 Million People Served By Systems With Lead Violations. Public officials have often failed to step in when water systems violate the federal Lead and Copper Rule, according to a report released this week by the advocacy group Natural Resources Defense Council (NRDC) on the “extraordinary geographic scope” of lead contamination.

Are The Dangers Of Iron In Water Being Ignored? Iron in drinking water may pose more health risks than federal water regulators currently acknowledge.

Reference Source: Water Online

Pure Water Gazette Fair Use Statement

Emerging Contaminants: The NSF List

The list of possible new water contaminants is endless, since new chemicals are issued much faster than regulators can test them.

Traditionally, ANSI/NSF certification has been divided into two categories: the contaminants with known adverse health effects, like arsenic, and items like the taste and color of water, which are aesthetic issues not known to affect health.

Emerging contaminants are a new category of water quality concerns for which evidence of health effects has not yet been established due in part to the trace levels at which these compounds are currently being detected.

The newer chemicals that are being listed by regulatory agencies are seen below in the Emerging Contaminants list being tested to a new NSF standard called American National Standard NSF/ANSI 401.  You’ll see some familiar names in the list. Yes, DEET is the stuff you spray on your body to discourage mosquitos,  Ibuprofen is what you take for a headache, and Bisphenol A (aka BPA) is the ingredient in plastic bottles you’ve been trying to avoid.

Note that the allowable amount for all of  these is expressed not in parts per million, or parts per billion, but in ng/L, nanograms per liter.  One nanogram per liter is one one-millionth of one milligram per liter. Expressed differently, one nanogram per liter is the equivalent of one part per million of one part per million of the whole. When you think of it as slicing a pie into a million pieces then one of the pieces into a million pieces, that isn’t much.

To understand how NSF testing is done, what the chart tells you is that if they take a solution containing more or less 200 ng/L of the angina and blood pressure medicine Atenolol and put it through a filtration device, the device must reduce the Atenolol content to 30 ng/L or less to receive NSF certification.

It is noteworthy that the fairly short list of devices that have attained NSF certification for removal of Emerging Contaminants includes only carbon filtration devices, and some of these are small devices like refrigerator filters or pitcher filters. The moral is that if you drink water from a good carbon-based drinking water filter, or a reverse osmosis unit, you can safely stop worrying about being overcome by the page-long list of health problems associated with the anti-seizure drug Carbamazepine.


Substance Average influent challenge ng/L* Maximum effluent concentration ng/L*
Meprobamate 400 ± 20% 60
Phenytoin 200 ± 20% 30
Atenolol 200 ± 20% 30
Carbamazepine 1,400 ± 20% 200
TCEP 5,000 ± 20% 700
TCPP 5,000 ± 20% 700
DEET 1,400 ± 20% 200
Metolachlor 1,400 ± 20% 200
Trimethoprim 140 ± 20% 20
Ibuprofen 400 ± 20% 60
Naproxen 140 ± 20% 20
Estrone 140 ± 20% 20
Bisphenol A 2,000 ± 20% 300
Linuron 140 ± 20% 20
Nonyl phenol 1,400 ± 20% 200


Source of NSF Chart.

Q