Our Coconut Shell Catalytic Carbon Backwashing Filter for Whole House Treatment
For City Water Treated with Either Chlorine or Chloramine
We’ve been selling whole house filters to city water for several years in a variety of styles, with different carbon choices and different control valve configurations. The filter on this page is the best backwashing filter we can build for city water users. We present it in four basic sizes, with size recommendations based on family size.
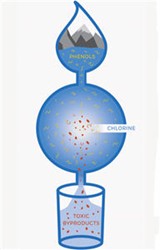
American cities use either chlorine or chloramine as the basic disinfectant. Both have advantages and disadvantages, but it’s no secret that when chlorine or chloramine reach your home they’ve done their job and you will like the water much better if you remove them from water that you bath in and drink. The premium coconut shell catalytic carbon filter is designed for top performance either with chlorine or chloramine.
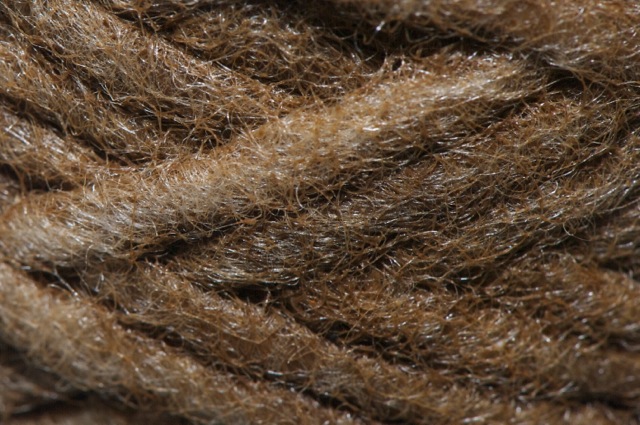
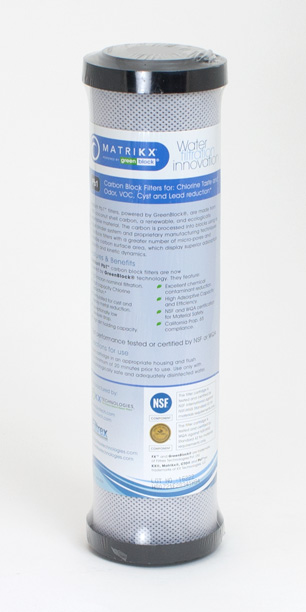
An issue in filter choice is that although chloramine and chlorine are removed by filter carbon, chloramine is much harder to remove, so a specialty carbon known as “catalytic carbon” is the carbon of choice if your city uses chloramine. The high quality catalytic carbon used in the filters below is Aquasorb coconut shell catalytic. It is excellent for chloramine and much better than it has to be for chlorine removal. Aquasorb is a hard carbon for long life and it is exceptionally clean carbon that puts few if any carbon particles (fines) into home service lines.
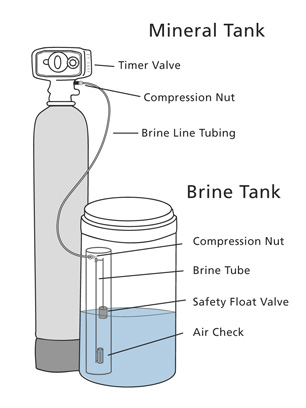
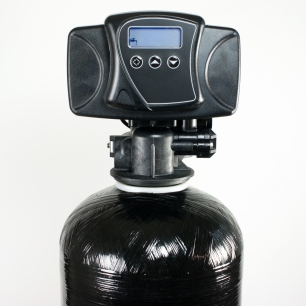
The mineral tank is the water-saving Vortech and the control valve is the SXT electronic version of the tough and reliable Fleck 5600.
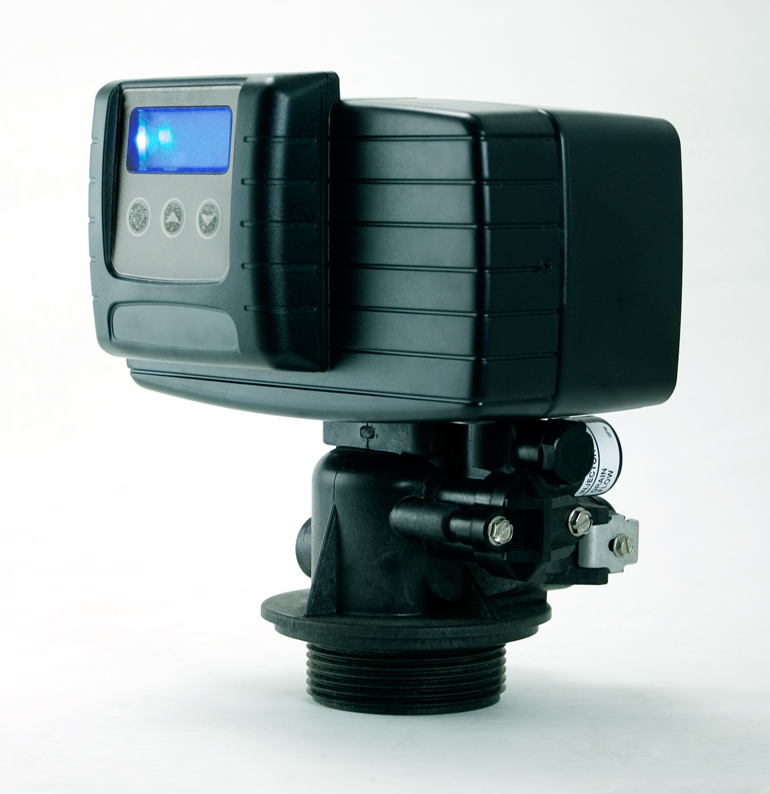
5600 SXT
Unit Description
| Tank | Black Vortech. No support bed needed. Excellent service flow. Saves thousands of gallons of backwash water over its lifespan as compared with conventional media tanks. 10 year manufacturer’s warranty. |
| Control Valve | Fleck 5600 SXT. Digital version of the old faithful 5600 mechanical timer. Programmed before shipping. Installer has only to set the time of day. |
| Extras | Stainless steel bypass. Flexible drain tubing. Instructions for installation and startup. Support by phone or email. |
| Media | The best carbon available. Jacobi Aquasorb coconut shell catalytic. Extra clean, effective for both chlorine and chloramine plus all the other chemicals that carbon removes. Extremely hard and durable carbon for a long life and minimum release of particles (fines). |
| Shipping | Shipped UPS. We pay shipping. Ships within one or two days of receipt of order. |
| Recommended media replacement | 5 years. This can vary according to use and local conditions. |
Note: These filters are for homes with ¾” or 1″ service pipes. Please call for information about equivalent filters for larger applications.
| Part Number | Tank Size. Media Load. | Family Size Recommendation |
| BW011 | 9″ X 48 – 1 cubic foot. |
Chlorine: Up to 3 people. Chloramine: 1 or 2 people. |
| BW012 | 10″ X 54″ – 1.5 cubic feet. |
Chlorine: Up to 4 people. Chloramine: 2 to 3 people. |
| BW013 | 12″ X 52″ – 2 cubic feet. |
Chlorine: Up to 4 to 6 people. Chloramine: up to 4 people. |
| BW014 | 13″ X 54″ – 2.5 cubic feet. |
Chlorine: Up to 7 people. Chloramine: Up to 5 people. |
Jacobi Aquasorb Coconut Shell Catalytic Carbon Spec Sheet
Other Backwashing Filters in This Series. Prices for these units can be seen on this page as well.