Tap Water Problems Found To Be More Prevalent In Poor, Minority Communities

by Sara Jerome

Tap water problems and shoddy water infrastructure are rampant in poor African-American communities, according to a report published by the Center for Public Integrity.

Campti, LA, is one example.

“Like many poor African-American communities, Campti’s poverty is a significant impediment to making crucial improvements to the town’s infrastructure — including its old water system,” the report said.

More than half of Campti’s population lives in poverty, and the median income is under $16,000 the report said.

Lifelong resident Leroy Hayes said the water often smells like bleach or takes on a brown hue.

“The water system in Campti is more than 50 years old, according to an audit from the Louisiana legislative auditor. Near the end of 2016, the water tank sprang several holes, some of which were temporarily plugged with sticks. A new tank was built in March, but residents still don’t trust that the water is safe,” the report said.

Former Campti Mayor Judy Daniels explained that local water problems “get worse after a storm or power outage because the water pump does not have a backup generator,” the report paraphrased.

Uniontown, AL, is another example.

“Black residents blame a swell of gastrointestinal complications on the waste from a nearby catfish farm they say pollutes their drinking water. In parts of North Carolina, impoverished African-Americans sometimes rely on contaminated wells for drinking water — though public water systems run just a few feet from their homes,” the report said.

Jacqueline Patterson, the director of the NAACP Environmental and Climate Justice Program, said communities of color are “disproportionately affected by polluting industries because they are more likely to be located near low-income neighborhoods.”

The recent report by News21 noted that water violations occur at systems in every part of the country. But there are clean patterns governing which areas are hardest hit, the report said.

“Drinking water quality is often dependent on the wealth and racial makeup of communities, according to News21’s analysis. Small, poor communities and neglected urban areas are sometimes left to fend for themselves with little help from state and federal governments,” the report said.

Manuel Teodoro, a researcher at Texas A&M University, cited a “bias” when it comes to water safety.

“These are not isolated incidences, the Flints of the world or the Corpus Christis or the East Chicagos,” Teodoro said. “These incidents are getting media attention in a way that they didn’t a few years ago, but the patterns that we see in the data suggest that problems with drinking water quality are not just randomly distributed in the population — that there is a systemic bias out there.”

The crisis in Flint, MI, helped highlight the problem of lead contamination. Mother Jones reported that the problem is a particular threat to minority communities.

“Economically and politically vulnerable black and Hispanic children, many of whom inhabit dilapidated older housing, still suffer disproportionately from the devastating effects of the toxin. This is the meaning of institutional racism in action today,” the report said.

Source: WaterOnline.

Pure Water Gazette Fair Use Statement

Carbon Filters Galore

We just counted.  In the “Cartridge Menu” at purewaterproducts.com there are more than fifty separate carbon filter cartridges, and that’s just in the four standard sizes.  These range from carbon blocks to granular carbons, many with specialty additives like calcite and KDF.  There are coconut shell carbons, bituminous carbons, and lignite carbons; there are carbon filters enhanced to remove lead and cysts, to prevent scale buildup, to inhibit bacterial growth, to remove fluoride, to reduce tannins, to raise pH. There are carbon filters that target VOCs and others that offer fantastically long and effective chlorine reduction.

In addition, there are “proprietary” carbon filters for a number of brands (Microline, Hydrotech, or example), inline carbons (from Pentair and Omnipure), aftermarket knock-offs (Multipure), and several ceramic candles with carbon cores.

Filter carbon is the central core of most modern water filtration systems. For some 90% of the water contaminants monitored by the EPA, carbon filtration is the preferred treatment. We hope you’ll look over our carbon collection. Our “Cartridge Menu” offers extensive information on all the carbon filters that we sell, including pictures, performance summaries, and links to manufacturers’ brochures.


Dams, reservoirs, canals and safe drinking water matter for absolutely everyone

By Sean W. Fleming

Gazette’s Introductory Note: We strongly support President Trump’s frequently stated plan to spend heavily on national infrastructure. Nothing could be more important, and such a project is long overdue. We’re way behind on fixing bridges, pipes,  and drainage networks. There are estimated to be over 55,000 US bridges that are badly in need of repair or replacement. We hope that these items can take precedence over walls and jails. The Scientific American article that follows suggests some directions that the president’s plan could take.

Cars are seen in the water as a span of highway bridge sits in the Skagit River May 24, 2013 after collapsing near the town of Mt Vernon, Washington late Thursday. REUTERS/Cliff DesPeaux

What implications will Trump administration policies have for America’s rivers?

When I was first asked this, I felt like a school kid caught daydreaming in class by the teacher. It was during the Q&A following a public talk I’d given at the Smithsonian a few months ago on the science of rivers, and I didn’t have a ready answer. I’m a science geek, not a policy wonk. The talk had been about things like why rivers run where they do, how the same river can experience drought one year and spill its banks the next, and how the amazing universality of mathematics leads to the same equations being used for operational flood forecasting and Wall Street derivative pricing models.

I also felt wary about speaking to political issues on behalf of all science, especially at a time when folks are unusually polarized, sensitive, and ornery; the credibility and influence that science holds with leaders and the public relies on scientists being seen as neutral third-party technical experts. But then again, water resource science isn’t quantum loop gravity. We’re practical people engaged in a practical science, and it’s not like my colleagues and I never contemplated the intersection between hydrologic science and society.

So I offered the audience this fundamental, if vague, response: if we want to maintain forward momentum irrespective of whichever party wins any given election, it’s important we build a wide base of support by rejecting the increasingly common—and false—notion that there can only be two ways of viewing the world, one which is protective of water, rivers, and the environment, and the other not.

I also posited that this should not be too hard to accomplish, because while there are different ideas on how to best manage water, just about everyone agrees it’s important, regardless of whether you live in the city or the country, on the coasts or in the interior of the continent, in a blue state or a red state.

But if I was asked that question again today, I’d add this key corollary: the Trump administration;s drive to renew America’s infrastructure offers powerful, if perhaps unexpected, synergies with pushing water resource science forward. At first glance, infrastructure renewal may seem less about science and more about the tough but wise decision to allocate funds for long-term investments that in most years don’t seem like an immediate priority. But if we’re going to repair America’s increasingly rickety water infrastructure, let’s do it right, making focused investments in the applied scientific R&D needed to ensure a new generation of infrastructure is designed to support the needs of the American people and the American economy for another hundred years.

Rivers and their infrastructure, like dams, reservoirs, and canals, matter for absolutely everyone. Examples range from the obvious to the surprising. Rivers deliver drinking water, irrigation water for growing food and brewing beer, and the large amounts of water required for industrial processes ranging from building cars to building computers. Rivers drive hydroelectric turbines, keeping the lights on and the economy in motion. Flood control infrastructure keeps us safe, and healthy rivers generate recreational, tourism, and fisheries dollars.

Rivers provided the transportation pathways by which early America was explored and through which it developed its own unique culture: think of the Lewis and Clark expedition, Mississippi gambling steamboats, and Huckleberry Finn. Even victory in WWII and the ensuing Cold War owed much to river infrastructure: aluminum used to build fighting aircraft, and uranium and plutonium in the first atomic bombs at White Sands and over Imperial Japan and subsequently in the growing US nuclear arsenal, were produced using copious hydroelectric power generated by Columbia River dams in the west and the Tennessee Valley Authority in the east. Harnessing and effectively managing water has been, and will continue to be, central to the economy, defense, and psyche of America.

While tremendous technical prowess and monetary investments went into our current water systems when they were first built–think of marvels like the Hoover Dam–today, much of our water infrastructure is old and either failing or otherwise not performing at the level America requires in the 21st century. The Oroville Dam incident and associated evacuation last winter is a potent reminder. There are many other examples: silting up and end-of-design-life for many dams nationwide; difficulties with fish passage and aquatic habitat, with implications to ecological health and therefore recreation, tourism, and commercial fisheries dollars; the ongoing saga of flooding in New Orleans, tied in part to Mississippi flows and the sometimes controversial control structures on it; and above all, the insufficient capacity to match the water and power needs of growing populations and economies, especially in the west. Cleary, renewing America’s rivers is a fantastic direction for the infrastructure investments President Trump wants to make.

To do this right, we need not only concrete and pipe but also a focused, goal-oriented investment in developing the science and engineering knowledge needed to ensure these rejuvenated systems do their job effectively and safely for a long time to come. We need to better understand both the natural and human-induced hydroclimatic variability of river systems so that infrastructure and associated decision support systems can be designed to better handle both flood and drought. We need to develop and test new principles for water infrastructure and river management that return the natural ecological functioning so important for tourism, fishing, and other industries. We need to discover new approaches that minimize the future maintenance budgets required for that infrastructure, and to invest in technologies that contribute to water conservation, ranging from fixing and updating leaky water distribution lines to promoting water-efficient manufacturing and agricultural processes.

We must enhance flood and water supply forecasting systems to further improve the efficiency of reservoir planning and management. Diversify the water portfolio; innovative work with desalinization plants and groundwater production from brine aquifers in California and Texas may provide an example. Ensure that every city in America has the infrastructure it needs to provide its citizens with a clean and safe drinking water supply; don’t let Flint happen again. And following the established pattern of history-making federal government-led successes, from the Apollo program to winning the Cold War, spread these investments in innovation across organizations and sectors, including academia, government, NGOs, and the private sector.

So, what will be the implications of the new administration for America’s rivers? That depends. If President Trump plays his cards right with his planned infrastructure investments, he could leave a tremendously positive long-term legacy around rivers, science and the economy.

Source: Scientific American.

Water Used in Food Production


Posted August 29th, 2017

How Much Water Is Really Used In Food And Beverage Production?

People concerned about their water footprint often make an effort to turn the faucet off quickly, take shorter showers, and cut back on watering the lawn.

While these efforts are important, they ignore one of the biggest water-use culprits found in virtually every household: food and beverages.

The production of food and beverages is a water-intensive process. According to the Water Footprint Network, a single apple requires an average of 33 gallons of water to grow. Here’s what other common food and beverage products cost in terms of water consumption according to the Water Footprint Network.

Beef: Beef is one of the biggest water-use culprits in the food industry, and is one of largest amongst meat products, utilizing an average of 1,845 gallons of water per pound of beef produced. Ninety-nine percent of the water used is for animal feed, with the remaining 1 percent coming from drinking and service water.

Coffee: Another big hitter for water use in the food and beverage industry is coffee.

To create one pound of coffee beans it requires 2,264 gallons of water. This means that the average cup of coffee, using .24 ounces of coffee beans, requires 34 gallons of water to produce.

Pork: The production of meat from pigs uses a global average of 717 gallons of water per pound. From 1996 to 2005 the global water footprint for pigs accounted for 19 percent of the total water footprint of animal production in the world.

Wine & Beer: To produce one gallon of wine requires 870 gallons of water. When looking at this fact from a standard serving size perspective, 34 gallons of water are needed for 5 fluid ounces of wine.  In France, Italy, and Spain, the largest wine producing countries in the world, the average water footprint of wine is 24, 24, and 52 gallons per glass of wine, respectively.

Beer production uses 296 gallons of water per gallon of beer, requiring an average of 28 gallons of water for 12 fluid ounces of beer.

Bread: Bread created from wheat flour has a global average footprint of 218 gallons of water per pound. Most of that water use, about 80 percent, is due to the flour that is derived from the wheat, so the exact water footprint of bread depends on the origin of the wheat and how it was grown. From 1996 to 2005, global wheat production contributed 15 percent to the total water footprint of crop production in the world.

Citrus and Stone Fruits: On average the global water footprint per pound are as follows: 67 gal./lb for oranges, 61 gal./lb for grapefruit, and 77 gal./lb for lemons.  A single orange requires approximately 21 gallons of water to produce. Orange juice comes at a higher water cost, utilizing 122 gallons of water to produce one gallon of orange juice.
Plums require 261 gal./lb, apricots 154 gal./lb. and peaches 109 gal./lb. Apples, bananas, grapes, and kiwis all take less than 100 gal./lb. Strawberries, pineapple, and watermelon require less than 50 gallons of water per pound of fruit.

Potato: The global average water footprint of a potato is 34 gallons per pound. China, the largest potato producing country in the world, contributed 22 percent to the total water footprint of potato production in the world.

Source: KLa Systems

Pure Water Gazette Fair Use Statement


 Maintaining the Quartz Sleeve


quartzsleevewithmike

 Certified Viqua Installer Mike aims a disapproving eye at a customer’s quartz sleeve during a service call in Flower Mound, TX

An essential part of any ultraviolet water purification system is a clear tube that looks like glass but is really made of quartz. It forms a barrier between the UV lamp and the water being treated. The tube is called a quartz sleeve. The UV lamp is housed inside the sleeve and the water is on the outside, so the lamp’s UV dosage that actually gets to the water depends on how clean and clear the quartz sleeve is.

Ultraviolet units are normally preceded by a five micron sediment filter to assure that the water being treated does not contain particles large enough to provide shade that would protect microbes from the germicidal lamp. The filter, however, does not remove minerals in the water that can form scale on the outside of the very hot quartz sleeve. The most common scaling agents are hardness (calcium and magnesium) and iron.

Regular maintenance of a UV system includes examining, cleaning, and, if necessary, replacing the quartz sleeve to assure maximum UV transmittance. Recommended cleaning is with a clean, lint-free cloth soaked in vinegar or another mild acid. It is also highly recommended that you handle with care, don’t leave finger prints, and don’t break the sleeve. Especially don’t break it.

 quartzsleevewithmike2The sleeve cleaned up nicely with white vinegar and some scrubbing.  Mike is happy. 

Manufacturers’ quartz sleeve recommendations vary, some recommending sleeve change with every second lamp change even if the sleeve appears clear to the eye. This is because UV light can degrade the quartz and block efficient UV transmittance even if the sleeve appears to be crystal clear.

Q

Hydrogen Sulfide

The “rotten egg” odor that people complain about in well water can come from many sources, but it is most commonly caused by  “sulfur reducing” bacteria that give off a foul-smelling gas. The bacteria themselves are harmless–they don’t cause disease–but the gas they produce can cause horrible odors and smelly black staining in pipes and appliances.


In some parts of the country, most notably Florida, where hydrogen sulfide is common and very severe, the standard treatment is to spray the water into an open air tank, allow the noxious gas to escape into the atmosphere, then use a secondary pump to send the water from the tank into the home. Tanks of this type are expensive, need lots of space, and are subject to freezing in cooler climates. Therefore, another type of treatment known as “precipitation/filtration” is preferred in most areas.


With this method, an “oxidizer” causes the trapped hydrogen sulfide gas to “precipitate” to elemental sulfur, then the sulfur is trapped in a filter. It’s a two-step process. The filter is most often carbon.  Filter carbon, especially a specialty carbon called “catalytic carbon,” can perform both steps–precipitation and filtration–but unless the amount of  H2S (hydrogen sulfide) is small, the carbon wears out quickly and has to be replaced. However, when the carbon is helped by a more powerful “oxidizer,” the carbon can last a very long time and the process can be very successful. Many “oxidizers” can cause the precipitation of the gas: air, chlorine, hydrogen peroxide, potassium permanganate, ozone, and more. For residential users, the most practical and the most easily maintained are aeration (air) and chlorination.


A full treatment system with chlorine looks like this–


1. A dry pellet chlorinator — a device that drops chlorine pellets into the well itself– followed by a carbon filter, or


2. A chemical feed pump, installed before the pressure tank, that feeds liquid chlorine (household bleach) into the water line.  After the pressure tank, you must have a retention tank–usually 80 to 120 gallons–to give the chlorine time to work.  After the retention tank, a carbon filter.


A full treatment system with aeration looks like this —


1. An “Aer-Max” system, which consists of a 10″ X 54″ treatment tank that is fed by a small air compressor.  It is installed after the pressure tank, and it is followed by a carbon filter, or


2. A “single tank aerator” installed after the pressure tank. It is a backwashing filter with a special control valve that draws in air to “oxidize” the H2S so that it can be removed by the filter carbon in the bottom 2/3 of the tank.


Here are page links that show the various strategies. Many have installation diagrams.


Dry Pellet Chlorinator — http://www.purewaterproducts.com/dry-pellet-chlorinator


Chemical Feed Pump and accessories — http://www.purewaterproducts.com/chemical-feed-pumps


“Aer-Max” units.– http://www.purewaterproducts.com/aer-max-aeration-systems


Single Tank Aerators — https://www.purewaterproducts.com/single-tank-aerator


The carbon filter used in any of these system (other than the single tank aerator) can be either a “backwashing” tank-style filter or a carbon block filter.  If iron is present in the water, a backwashing filter must be used because a carbon block filter would be clogged quickly with iron.


Catalytic carbon is the carbon of choice with hydrogen sulfide, but any good carbon filter will work after proper oxidation.


Here are some places on our website to look for carbon filters —


5600 10 X 54 filters — https://www.purewaterproducts.com/fleck-5600-backwashing-filters


Filters to follow Aer-Max — https://www.purewaterproducts.com/filters-to-follow-aer-max


Carbon block filters — https://www.purewaterproducts.com/whole-house-filters-compact


Often the hard part of designing these filters is choosing and sizing the carbon filters.  Do not hesitate to call or email us for help.


Poison once flowed in America’s waters. With Trump, it might again

As a scientist working for decades on national and global water and climate challenges, I must speak out against what I see as an assault on America’s water resources.

I grew up in New York in the 1960s hearing about massive Polychlorinated Biphenyl – a toxic chemical used as a coolant – contamination in the Hudson River and the threatened extinction of bald eagles and ospreys from eating contaminated fish.

I remember watching on television Ohio’s Cuyahoga River burning. I remember scientists warning about the death of the Great Lakes and Chesapeake Bay from uncontrolled industrial pollution. I remember not being able to swim at beaches polluted with raw sewage.

And I remember the public debate and bipartisan enthusiasm for federal action to clean up our waters – enthusiasm that led to passage of one of the nation’s foundational environmental laws, the Clean Water Act, signed into law by Richard Nixon in 1972.

This law and the related federal regulations reduced water pollution and protected some of the nation’s rivers and lakes, but they are incomplete, only partially implemented, and increasingly outdated in the face of new threats from unregulated contaminants, worsening climatic changes, failing water infrastructure and direct political assault.

Donald Trump claimed he’d work to promote clean water. This claim has proven to be hollow. Since taking office, the president, administration officials, and the Republican-led Congress have moved aggressively to roll back decades of water-quality protections put in place by previous Republican and Democratic administrations.

These moves benefit industrial polluters rather than local communities, hinder progress toward cleaning up contaminated water and deteriorating ecosystems and worsen public health risks.

To address these problems, the Obama administration developed new rules to remove mercury from municipal sewage; impose limits on the amount of toxic and bioaccumulative water pollutants such as arsenic, lead, mercury, and cadmium that can be released from power plants; control previously unregulated pesticides; stop the dumping of coal wastes into streams and clarified authority for the US Environmental Protection Agency (EPA) and Army Corps of Engineers to extend protections to around 60% of the water bodies in the United States – the so-called Waters of the United States, or WOTUS, rule, also known as the Clean Water Rule.

The Trump administration and Congress have moved to rescind every one of these environmental protections.

Immediately after Trump’s inauguration, the EPA announced the agency’s intention to cancel the new regulation to cut mercury pollution in urban wastewater.

Mercury is a persistent neurotoxin affecting the brain and nervous system and scientists estimate that more than 75,000 infants in the US each year have an increased risk of learning disabilities associated with prenatal exposure to methylmercury. The largest single source of mercury contamination in urban wastewater comes from dental offices and the new rule required dental offices to install inexpensive and effective equipment to capture rather than dump mercury.

In April, EPA administrator Scott Pruitt proposed to postpone the compliance dates for meeting the new limits on toxic water pollutants from power plants. This rule would have reduced pollutant releases by 1.4bn pounds a year – including chemicals that lead to cancer and other illnesses in humans, lowered IQ in children, and deformities and reproductive damage in fish and wildlife.

The Clean Water Rule was published in June 2015 after years of scientific study, more than 400 public hearings, and literally a million public comments. It provides a critical tool for tackling persistent pollution problems from pesticides, fertilizers and industrial chemicals in water that previously lacked regulations.

Eliminating the Waters of the United States rule was an explicit objective of the Republican platform, and Trump signed an executive order in February 2017 asking the EPA and US Army Corps of Engineers to review and either rescind or revise it. In late June, the EPA announced it would move to completely replace it, removing protections from vast areas of the country.

Finally, Trump’s proposed budget imposes massive cuts to federal water-quality protections. The EPA office that develops standards for pollution in drinking water, already years behind in setting limits for unregulated pollutants, would have its budget cut in half.

The Superfund program, responsible for cleaning up severely polluted industrial sites, including many contaminating or threatening groundwater, would be cut 25% and enforcement would be cut 40%.

Programs that support environmental cleanup in Long Island Sound, Chesapeake Bay, the Great Lakes, San Francisco Bay, and other waterways would be cut to zero. The EPA’s office for scientific research and development would be cut in half.

Federal grants to states to identify and prevent leaks from underground storage tanks and programs to reduce lead exposure, like that seen recently in Flint, Michigan, would be eliminated. If we do nothing, undrinkable water could be one of Trump’s most poisonous legacies.

The good news is that Americans care enormously about clean water. The annual Gallup Poll on the environment ranks worries about water pollution above any other environmental issue, now higher than they’ve been since 2001. Scientists, public health officials, and environmental groups are also fighting back.

Lawsuits have been filed in federal court arguing that the Trump administration doesn’t have the legal authority to delay these protections, hasn’t given public notice or allowed public debate, is ignoring proven science and has acted to prioritize the interests of the coal and chemical industries over public health.

And there has been some success: in early June, in the face of a lawsuit by the Natural Resources Defense Council, the EPA agreed to let the mercury rule go forward. Some Republican members of Congress have publicly expressed concernover the severity of the proposed federal budget cuts to environmental protection.

We’ve come a long way from the era of unregulated dumping of chemicals in our streams, burning rivers, and dying ecosystems. I’m optimistic that the goal of clean, fishable, swimmable waters nationwide is achievable. But the Republican party is moving rapidly to become the party of dirty water. That’s not in their interest and it’s not in the interest of the nation. It’s time scientists and the public speak out.

Source:  The Guardian.

Pure Water Gazette Fair Use Statement

High Performance Aeration Systems

Pure Water Products now offers a high performance (CAP) air pump and installation kit for our AerMax units.

CAPpump

High capacity air pump for use with AerMax systems.

The high volume pump is a small but tough unit designed for iron and hydrogen sulfide treatment. It is for use with all constant pressure well systems, high flow applications, and anywhere higher pressure or higher air turnover is needed. Suggested uses include commercial applications, hotels, restaurants, multi-tap applications, irrigation systems, bottling plants,  large homes,  or wells that serve more than one home. It is recommended for residential constant pressure systems.

CAPinstallkit

Installation Kit for High Capacity Air Pump includes 2 stainless steel check valves, heavy duty mounting shell, tube connectors, 200 psi pressure gauge, and pressure regulator.

Prices for pumps and Installation Kit

Part Number Description Price (includes shipping)
AM100 115 V. Heavy Duty Air Pump Call for pricing.
AM101 230 V. Heavy Duty Air Pump Call for pricing.
AM102 Heavy Duty Installation Kit (works with both pumps above) Call for pricing.


Also available are high flow aeration tank heads and over-sized aeration tanks. Please call for information and pricing.

Pure Water Products

888 382 3814


Planet marks new highs for heat, pollutants, sea level in 2016: report

by Kerry Sheridan

earthsweating


Washington (AFP) – The Earth set a series of dire records in 2016, including hottest year in modern times, highest sea level and most heat-trapping gases ever emitted, a global climate report said Thursday.

A range of key climate and weather indicators show the planet is growing increasingly warm, a trend that shows no signs of slowing down, said the annual State of the Climate Report.

“Last year’s record heat resulted from the combined influence of long-term global warming and a strong El Nino early in the year,” said the report.

“The major indicators of climate change continued to reflect trends consistent with a warming planet,” it added, noting that several markers — such as land and ocean temperatures, sea level and greenhouse gas concentrations in the atmosphere — broke records set just one year earlier.

The ominous news comes two months after President Donald Trump announced the United States would withdraw from the 2015 Paris accord on global warming, a decision that sparked widespread international criticism.

In the past billionaire Trump has called climate change “a hoax” invented by the Chinese, dismissing scientific evidence of human contributions to rising temperatures.

But as humanity continues to rely on fossil fuels for energy unprecedented levels of greenhouse gases are polluting the atmosphere, acting like a blanket to capture heat around the Earth, the report emphasized.

All the major greenhouse gases that drive warming, including carbon dioxide (CO2), methane and nitrous oxide, rose to new heights, it said.

Atmospheric CO2 concentration reached 402.9 parts per million (ppm), surpassing 400 ppm for the first time in the modern record and in ice core records dating back as far as 800,000 years.

“Climate change is one of the most pressing issues facing humanity and life on Earth,” said the peer-reviewed publication, put together by nearly 500 scientists around the globe and released each year by the National Oceanic and Atmospheric Administration and the American Meteorological Society.

Source: Yahoo News.

Removing Chloramines and Ammonia from Residential Tap Water

by Emily McBroom and Gene Franks

centaurCatalytic carbon has long been recognized as the most effective method of chloramine reduction. Our research supports that view.

Removing chloramines from city water is one of the hot topics in water treatment. Driven by internet discussion and advertising, there are lots of theories, lots of controversy, and a whole lot of myths.

When people look for a chloramine reduction product one of the first questions they ask is, “How much does it remove?” The expected answer is a neat percentage. What they usually get from us, though, is a truthful but vague answer that goes something like, “Well, chloramine reduction can depend on a lot of variables, like the rate of flow through the filter (residence time), physical factors like turbidity and temperature, pH, mineral content of the water, pre-treatment, etc. In other words, it can vary a lot.” A truthful answer, but not very satisfying.

So, to put some numbers into the equation, we decided to do some testing of our own on the actual products we sell and on our own tap water. Our testing is not offered as a guarantee of performance in all situations–just a snapshot of what we found when we tested various products being fed our local  chloramine-treated tap water. For the purpose we bought a Hach Pocket Colorimeter that tests only chloramine and ammonia.  We tested actual consumer products, some brand new, some well used, at varying flow rates, using our local tap water for the tests.

In every case, we tested both chloramine and ammonia. When chloramine is reduced by filtration, according to the standard explanation of the process, chlorine is separated from the ammonia and converted to chloride. The ammonia is left behind as an undesired by-product.  More about ammonia later.

According to the city of Denton’s most recent water quality report, the average chloramine level in our tap water is 3.41 milligrams per liter (mg/L).  Before each sequence of tests, we did a “base line” test from the tap and made the assumption that the product we were testing was being challenged with that amount of chloramine and ammonia. In most cases, we found the actual at faucet chloramine content to be a little less than the city’s average. In all we did over a dozen tap water tests, which showed chloramine levels from 1.83 mg/L to 3.52 mg/L with an average of 2.6 mg/L. The readings were taken at several locations in the city, both at our business and at homes where we have equipment installed. In other words, these are “real life” tests using the water that comes through the pipes, not laboratory simulations.

Here are some items we tested:

The Chloramine Catcher

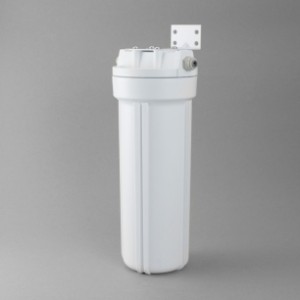
The Chloramine Catcher is our signature “whole house” chloramine product, a backwashing filter with catalytic carbon. We supply it with Centaur catalytic carbon and offer Jacobi Aquasorb coconut shell catalytic as an alternative. We call it the “Chloramine Catcher”  because it is designed for chloramine reduction. In spite of its pretentious name, the filter has no magic properties or secret ingredients: it is a catalytic carbon backwashing filter built with a Vortech mineral tank and a tough Fleck 2510 control valve. We sell the same filter for hydrogen sulfide treatment for wells.

In our chloramine reductions tests,  the Chloramine Catcher lived up to its name, removing 98.2% of the chloramine the first day we tested it, 99.2% on the second test,  and 100% on the third. (“One hundred percent” means reduced to below the detection level of the test, 0.01 mg/L. Keep in mind that in water treatment, nothing removes all of anything.) This was one of three tests we made where chloramine was reduced to below the detection point of the test equipment. Our office version of the Chloramine Catcher, the one we tested, is a 10″ X 54″ tank with 1.5 cubic feet of Jacobi Coconut Shell Catalytic Carbon.  The carbon is about three years old, but it has had an easy life, filtering only for two bathrooms and a utility sink. Just broken in well.

We also tested a Chloramine Catcher with Centaur Catalytic Carbon installed in a Denton home.  Chloramine reduction was 100%.  The unit was over 10 years old, but the carbon had been replaced about two months previous.

Two Top Quality 2.5″ X 9.75″ Carbon Blocks

We tested a drinking water size cartridge that we use a lot in countertop filters, undersink filters, garden hose filters, and as a reverse osmosis postfilter. It’s a sub-micron standard coconut shell carbon block, the MatriKX CTO Plus,  that the manufacturer recommends for chlorine and VOC reduction but not for chloramine treatment. The CTO Plus is made with standard carbon, not catalytic. (Catalytic carbon is filter carbon that has been specially processed to enhance the properties that affect reduction of contaminants like iron, hydrogen sulfide, and chloramines.)  We tested the CTO Plus at different flow rates to check the effect of residence time on chloramine removal. The result:

At 1 gpm flow rate – 66.9% chloramine reduction.  (In a subsequent test the cartridge removed 88%, leading us to believe that in our initial test the cartridge had not been sufficiently broken in.)

At 0.5 gpm flow rate – 99.6% chloramine reduction.

The lesson, of course, is that residence time matters. People who use this cartridge in an undersink or countertop drinking water filter get better performance than those who put it in a garden hose filter and spray water at 2 gpm on their turnip patch. Lesson number two: any good carbon filter will remove chloramine if you give it enough time.

By contrast, the Pentek ChlorPlus 10 in the 9.75″ x 2.5″ size, a filter designed specifically for chloramines, got 99% chloramine reduction at 0.5 gpm and the same 99%  at 1.0 gpm.  Two other tests of the cartridge at 0.5, prefiltering for an ammonia-removal test, got 100% and 99.5% reduction.

More Carbon Filters 

We tested a variety of carbon filters, from an inline refrigerator filter to a whole house carbon block–some made with standard carbon, some with catalytic. 

A standard GAC refrigerator filter with coconut shell GAC fared worst with 45.3% chloramine reduction at a moderate but unmeasured flow rate.

We tested a “whole house” MatriKX CTO (4.5″ X 20″) installed at a Denton home. This is a 5 micron standard coconut shell carbon cartridge. The cartridge, about a month old,  removed 95% of the chloramine at “shower speed,” 3 gpm, although the manufacturer makes no chloramine reduction claim. We tested the same filter after two more months’ use and it removed 97%.

We tested a 2.5″ X 9.5″ version of the MatriKX CTO (same filter as above, but drinking water size) that we use as an RO prefilter. We ran it at 350 milliliters per minute (the very slow feed flow rate of an undersink reverse osmosis unit) and it removed 99.6% of the 2.75 ppm chloramine in the tap water that day.

We tested  two 2.5″ X 10″ granular carbon filters, one with standard coconut shell GAC (97.8% chloramine reduction at 0.5 gpm) and one Centaur Catalytic Carbon (100% chloramine reduction at 0.5 GPM).

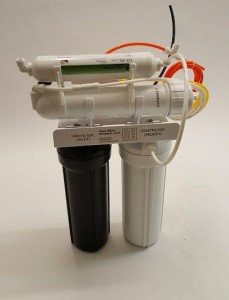
Black and White Undersink Reverse Osmosis

We did several tests on our house brand reverse osmosis units, some in our office, some in homes, and with different configurations and filter age. Chloramine reduction ranged from 100%–the most common–down to 97.6%. Most units were standard 3-stage systems with MatriKX CTO prefilter and MatriKX CTO Plus post filter. Some had 4th-stage post filters which we added to test ammonia reduction. In general, all RO units we tested removed almost all the chloramine.

Shower Filters

We tested a standard KDF-based Sprite shower filter, known to be an excellent chlorine reducer.  We tested twice with a shower water feed rate and it removed 20% and 21%.  We tested a Vitashower Vitamin-C shower filter (technically an ascorbic acid injector rather than a filter). On the first test–with only a 5 minute break-in rinse, in violation of the manufacturer’s instructions–it removed only 42%.  After a 10 minute break-in rinse, however, it removed a respectable 94.8%.

KDF Cartridges

KDF plays an essential role in chloramine reduction, according to internet lore.

We put 1.5 lbs. of KDF 55 into a cartridge, without carbon, and tested at 1 gpm.  Result: 18.2% chloramine reduction.

We put a MatriKX CTO Plus cartridge after the same KDF filter and the result was 97.7% reduction at 1 gpm.

We tested a 1.5 lb. KDF 85 cartridge at 1 gpm with the result of only 01.4% reduction–probably not quite as good as running the water through a paper towel.

RO Membrane

We tested a Pentek GRO membrane without pre- or post-filters.  As expected, chloramine reduction was an insignificant 9.8%.

The Ammonia Dilemma

After “how much chloramine does your filter remove?” the next question is usually, “does it also remove ammonia?”  The correct answer is, “No, it actually adds ammonia to the water.”

The standard explanation for chloramine reduction is that the catalytic action of the carbon breaks the bond between chlorine and ammonia then converts the chlorine to harmless chloride. The ammonia is left behind. In other words, after treatment you end up with more ammonia than you started with.

Virtually all of our tests supported this concept by showing an increased presence of ammonia after the chloramine was reduced by the filter.

The table below shows carbon filters removing chloramine. Note that in each case the liberated ammonia stays in the product water.

Carbon Filters Removing Chloramine. Ammonia Residual without Post Treatment

All values expressed in mg/L

Tap Water Before Treatment

Treatment Device

After Treatment

Chloramine: 2.24

Ammonia: 0.11

CTO Plus Carbon Block @ 0.5 gpm

Chloramine: 0.01

Ammonia: 0.55

Chloramine: 3.40

Ammonia: 0.08

GAC Inline (refrigerator) filter

Chloramine: 2.02

Ammonia: 0.27

Chloramine: 3.52

Ammonia: 0.13

Whole House CTO Carbon Block

Chloramine: 0.16

Ammonia: 0.54

Chloramine: 2.67

Ammonia: 0.17

Granular catalytic carbon (Centaur) cartridge, new but well broken in.

Chloramine: 0

Ammonia: 0.55

Chloramine: 3.25
Ammonia: 0.08
Whole House Filter with Pentair Radial Flow Granular Chloramine Cartridge  Chloramine: 0.04

Ammonia:0.55


The theoretical removal of ammonia is a complicated issue, and literature reveals that removing ammonia after chloramine reduction doesn’t always follow expectations.

Frank DeSilva explains ammonia removal as follows:

Ammonia can be present in water in two forms, either ammonium hydroxide (NH3) or as the ammonium ion (NH4).

When the pH of the water is less than 7 the ammonia is present as the ammonium ion. As pH increases above 7, more of the ammonia is present as ammonium hydroxide.

The ammonium ion is readily removed by cation resin. Good removal capacity can be expected in waters low in hardness. Waters that are high in hardness will have decreased capacity due to the simultaneous affinity and removal of calcium, magnesium and the ammonium ion.

What this means in practical terms is that adding a cation (water softening) cartridge after an RO unit should remove the ammonia left behind when the RO’s carbon filters have removed the chloramine.  This is because the RO membrane removes the hardness and also reduces the pH, creating an ideal situation for ammonia removal by the cation cartridge. (Ion exchange with zeolite is often recommended as a reducer of ammonia under these conditions as well.)

The table below includes carbon filters and RO units followed by a post treatment device.

Ammonia Residual with Post Treatment

All values expressed in mg/L

Tap Water Before Treatment Treatment Device After Treatment

Chloramine: 1.83

Ammonia: 0.14

Black and White Reverse Osmosis, 3 stage, with softening cartridge added.

Chloramine: 0.00

Ammonia: 0.01

Chloramine: 1.83

Ammonia: 0.14

Black and White Reverse Osmosis, 3 stage, with zeolite cartridge added.

Chloramine: 0.00

Ammonia: 0.01

Chloramine: 3.52

Ammonia: 0.13

Black and White Reverse Osmosis, 3 stage, with calcite cartridge added. Unit preceded by a standard carbon block whole house prefilter.

Chloramine: 0.00

Ammonia: 0.00

Chloramine: 2.11

Ammonia: 0.08

Pentek ChlorPlus 10 (9.75″ x 2.5″) Chloramine Reduction Cartridge followed by a softening cartridge @ 0.5 gpm.

Chloramine: 0.02

Ammonia: 0.02

Chloramine: 2.11

Ammonia: 0.08

Pentek ChlorPlus 10 (9.75″ x 2.5″) Chloramine Reduction Cartridge followed by a deionizing cartridge @ 0.5 gpm.

Chloramine: 0.01

Ammonia: 0.02

Chloramine: 2.75

Ammonia: 0.14

Black and White 3 Stage Reverse Osmosis Unit without post treatment.

Chloramine: 0.00

Ammonia: 0.05

Conclusions

We found the expected, plus a couple of unexpected results.

In general terms, contrary to some internet lore (we’ve been told more than once that “chloramine can’t be removed”), chloramine can be removed handily, although it’s considerably harder to remove than chlorine.

The same strategies that remove chlorine remove chloramine, although some devices work much better than others. Catalytic carbon is best, but standard carbon also removes chloramine well if you give it enough time. KDF, unless it is followed by carbon, is not an effective chloramine treatment.

Residential reverse osmosis units are particularly good at chloramine reduction because their carbon prefilter gets to handle the water at a very slow flow rate. While the RO membrane itself does not significantly affect chloramine, it may reduce ammonia.  (In our “membrane only” test, ammonia went down from 0.18 to 0.03 ppm.)

Vitamin C shower treatment is much more effective than KDF shower filters with chloramine.

Theoretically,  ammonia should be easily removed by cation exchange after an RO unit but not so easily after a carbon filter. Nevertheless, in the three tests where we used an ion exchange cartridge after a carbon block filter, ammonia was reduced to 0.02, 0.02, and 0.01. This was with feed water with a pH in the high 7’s and 7 grains of hardness. The result indicates that a water softener regenerated well before its hardness endpoint following a whole house catalytic carbon filter would probably do a credible job of ammonia reduction–not good enough, perhaps, for use in dialysis, but quite good for ordinary household use.