Do Oregon’s clear-cut and pesticide buffers protect drinking water from creeks, rivers?
by Scott Learn
ROCKAWAY BEACH — From her front porch, Nancy Webster has a clear view of the hills just east of the coast highway, a western hemlock forest that’s home to Rockaway Beach‘s water supply.
The retired social worker, who grew up in a Northwest logging family, worried when she saw patchwork clear-cuts expanding in 2011.
Last summer, she and a friend hiked into the watershed during a storm and saw the creek that feeds Rockaway Beach’s water treatment plant “running chocolate brown.” In September, she spotted helicopters spraying herbicides, catching distinct whiffs at her house a half-mile away.
Just like that, the latest highly motivated critic of Oregon’s Forest Practices Act,which governs private timberlands, was born.
“You can just see the mud washing off the slopes, and then a 20-foot buffer on logging along the creek,” Webster says. “It just seems like there is very little protection for the watershed.”
Timberlands are easier on water quality than cities and farms. The timeline between harvests runs for decades, and herbicides typically get sprayed only in the first years after a cut, until new trees are established.
But when it comes to stream buffers and herbicide applications, Oregon’s rules for private forests are less stringent than in neighboring Washington and far less stringent than in national forests.
After years of complaints, the U.S. Environmental Protection Agency is studying whether Oregon’s regulation of nonindustrial sources of water pollution, including timberlands, is good enough.
Jetty Creek
Oregon’s Forest Practices Act was the first in the nation to regulate private lands when the state adopted it in 1971. But disputes over it have bubbled up around the state.
In southwest Oregon, much of the congressional delegation favors applying the more lenient rules on 1.5 million acres of federal forests, raising concerns about the effects on rivers and drinking water.
Residents of Triangle Lake, west of Eugene, complain of drift from spraying on private timberland — and point to herbicides found in their urine. And the EPA and others question the effects on streams and salmon listed under the Endangered Species Act.
Along the coast, drinking water is a top concern.
Tom Merrell, manager of the Arch Cape Service District, says Oregon’s no-cut zone of 20 feet along significant streams doesn’t protect drinking water from herbicides and mud runoff, or “turbidity.” Washington’s no-cut zone is 50 feet. Turbidity adds to filtering costs and can boost harmful byproducts that arise when chlorine, a disinfectant added to kill bacteria, hits organic matter bunched in the water.
On Oregon’s north coast, 11 of the 18 public water systems fed by rivers or creeks have received alerts over the years for high levels of disinfection byproducts — trihalomethanes and haloacetic acids.
“These rules are archaic, and they’re weighted against anybody but the landowner,” says Merrell, who adds that the district has some of the costliest water rates in the state. “I’ve pleaded with (Oregon Department of Forestry) and landowners for years and years and years to strengthen these buffers, and I’ve just run up against the wall.”
The watershed that feeds Rockaway Beach runs 1,200 acres, with Jetty Creek the main conduit. On a steep hike along forest roads with Webster and other members of Rockaway Citizens for Watershed Protection, the part of the creek closest to U.S. 101 and the water plant is heavily forested and shaded.
Within a mile, clear-cuts emerge, scrabbly ground bumping into strips of trees along the creek. The citizen group’s analysis of Google satellite photos and harvest notices show that about fourth-fifths of the watershed was clear-cut since 2004, the majority since 2010.
As a drinking water stream, Jetty Creek gets some protection. But Oregon’s smaller, non-fish-bearing streams — which can be 80 percent of a watershed — get no buffer from cuts or spraying under the law. Washington, by contrast, extends its 50-foot, no-touch buffer to at least half of its small-stream network.
Stream buffers for aerial herbicide spraying are also smaller in Oregon than in Washington. And Oregon’s notification system is solely on paper and costly, with windows for potential sprays as long as six months.
The hikers pass tributary creeks still trickling in late July, with trees cut to the edge. Judy Coleman, Webster’s friend, compares it with the Portland-owned Bull Run watershed near Mount Hood, where logging has been prohibited since 1996.
“If this happened in the Bull Run, there would be an uproar,” says Coleman, a former water quality analyst for Oregon’s Department of Environmental Quality.
Ideally, she and Webster say, Rockaway Beach would buy this land, or at least an easement along streams. Another potential solution: Swap land with federal agencies, which use relatively little herbicide and have buffers of 150 feet on small streams, with only thinning allowed.
Since January 2011, Rockaway Beach officials have warned residents eight times about excess disinfection byproducts after quarterly testing. The byproducts can diminish liver, kidney and nervous system function, and increase the risk of bladder cancer, health officials say.
The district, which supplies 2,300 water hookups, spent $600,000 on a membrane filter two years ago for its new treatment plant, but that didn’t solve the problem. Now it’s spending $120,000 for an upstream sand filter to try to capture more silt.
A 2002 evaluation identified clear-cuts as a potential source of contamination. But Luke Shepard, Rockaway Beach’s public works director, says it’s not certain that logging is to blame. Treatments have changed, he says, and supplementing with well water has stopped, expanding reliance on Jetty Creek.
He shuts down the plant for 24 hours when turbidity runs high or after timber companies tell him an herbicide spray is coming.
“We’re kind of feeling the pressure from both sides,” he says. “Logging’s a pretty important industry around here, and there are a lot of conflicting interests with the watersheds.”
At this point, it’s unclear if logging contributes to the byproducts, says Kari Salis, a manager for the Oregon Health Authority’s drinking water program.
Organic material can flow in naturally. Treated water can hang out in coastal systems longer — demand drops when tourists depart — increasing chlorine contact with organics. And the state has no data on how much logging contributes organic matter to the water. Since protection of source waters is voluntary, Salis says, there’s “no regulatory hook.”
DEQ studies of coastal drinking water watersheds have pinpointed turbidity as a concern, but haven’t determined what causes it.
This fall, the agency will monitor Jetty Creek to try to catch potential impacts from herbicide spraying. Statewide, tests of treated drinking water rarely find herbicides.
Washington’s streamside protection rules are “considerably stronger,” DEQ officials say. Generally, studies show that clear-cuts increase water flow, powering streams to erode bank sediment or stir up streambeds, says Joshua Seeds, a DEQ drinking water program specialist.
But the connection isn’t specific enough to ask forestry officials to tighten rules.
“If we had direct analysis that said these practices equal this water quality impact, we would take (it) to ODF (Oregon Department of Forestry) and they would take it to their board,” Seeds says. “It is something we need to do more work on.”
The two timberland owners in the Rockaway Beach watershed — Stimson Lumberand Olympic Resource Management — say they often exceed state requirements.
Scott Gray, Stimson’s western resources manager, said company officials put more than minimum buffers along drinking water streams and work with local water managers to address concerns.
“We take our land stewardship responsibilities very seriously,” Gray said in an email.
Tim Raschko, Olympic’s director of timberland management, said the company cut 500 acres from 2010 to 2012, and spent $357,000 on logging road maintenance in 2011, four times the industry average per acre.
Runoff from roads is considered a prime source of sediment in streams long term, particularly during log hauling. Raschko said workers set up silt fences and sediment traps and monitored the creek for sediment.
The company notifies neighbors within 1,000 feet of spraying of herbicides, Raschko says, and tries to post more precise spraying dates, neither required under Oregon law. It also skipped herbicides in the clear-cut closest to the water plant, he says.
Raschko says he can’t answer whether Oregon’s forest rules — set by compromise as much as science — are adequate.
“But there’s science going on and we need to get answers on that quickly, so if things are inadequate, we can adjust,” he says.
The state Forestry Department is working with timber companies, university experts and other agencies on three studies to better gauge the effects of logging on streams.
The first report, on Hinkle Creek near Roseburg, found significantly more sediment from logging. A Coast Range study along the Trask River should show whether greater protection of headwaters would benefit water quality.
Lena Tucker, deputy chief of the department’s private forests division, says the state has adjusted rules often over the years, and will again if science supports it. After studies indicated runoff problems from log hauling during storms, for example, the state restricted it. The state also plans online notification of pesticide spraying by late 2014, replacing cumbersome paperwork.
The Oregon agency also bears in mind that forests generate better water quality than subdivisions or other uses, she says.
“Overall,” Tucker says, “our mission is to keep those working forestlands working.”
Source: Oregon Live.
Where Has All the Water Gone?
by Elizabeth Cutright
“They are sucking all of the water out of the ground, and there are just hundreds and hundreds of water trucks here every day bringing fresh water out of the wells.”
A few weeks back, I proposed a “water scarcity road trip” to visit the nine cities that, according to 24/7 Wall St., were in danger of running out of water. Last week, I wondered how long it would take for the powers-that-be to realize our dwindling reservoirs are equivalent to a climate change canary-in-a-coalmine.
This week, I’d hoped to cover something a little more upbeat—infrastructure funding, perhaps. Or recent developments in water treatment technology. Perhaps an overview of the latest demand management success stories from across the nation.
Instead, I’m forced to return once again to the well of water shortages—with two pieces catching my eye this Monday morning, both containing dire warnings about the state of our water resources and highlighting how the rule of unintended consequences is about to deliver a knock-out punch to water resource management.
Let’s start with yet another survey of water-strapped cities, this one conducted by the University of Florida in 2012. By assessing the “water availability and vulnerability for ss5 urban areas nationwide, based on fresh water per person,” this U of Florida report has resulted in a list of 20 cities vulnerable to extreme water shortages. Spanning several states and regions throughout the country, the list includes Duluth, MN, (at a startling #1); Tampa, FL; Tucson, AZ; Los Angeles, CA; and Chicago, IL. Ranked according to water availability, the list includes the usual suspects (clustered in the Southwest), along with some surprising contestants along the North Atlantic and the Midwest.
The researchers point to a variety of factors that contributed to the final list candidates, including allocation of resources as well as the potential for climate change and crumbling infrastructure to disrupt (and perhaps irrevocably damage) conveyance systems.
Meanwhile, in Texas, the water-energy nexus is coming head-to-head with the unintended (though not unpredicted) consequences of unrestrained natural gas extraction (aka fracking). According to a findings initially reported in The Guardian and explained further in an article from Mother Jones, approximately 30 Lone-Star communities could run out of water by the end of the year. And while fracking is only one piece of a puzzle that includes increased demand and three years of drought, many residents and experts believe that natural gas extraction—with its water requirements both in the initial well injection, but also with its pollution side effects—is accelerating water shortages throughout the region.
In describing the scene to Mother Jones, resident rancher Buck Owens told the magazine, “They are sucking all of the water out of the ground, and there are just hundreds and hundreds of water trucks here every day bringing fresh water out of the wells.”
As Mother Jones journalist Suzanne Goldenberg explains, fracking is only complicating the situation in West Texas, a region that already “has a long history of recurring drought” that is further complicated by climate change and a situation where “even as the drought bore down, even as the water levels declined, the oil industry continued to demand water and those with water on their land were willing to sell it.”
Nevertheless, even without fracking, the situation in Texas—with aquifers well past the ability to regenerate quickly—looks grim and perhaps another type of extreme weather can provide a respite if not a solution.
“We’ve got to get floods. We’ve got to get a hurricane to move up in our country and just saturate everything to replenish the aquifer,” Owens told Mother Jones. “Because when the water is gone, that’s it. We’re gone.”
Source: Water Efficiency.
Source: Inside Science.
Colorado River drought leads to reduced water releases
by Dennis Wagner
Editor’s Note: This is one of many articles that appeared this week describing the serious situation that exists for those lakes and cities that depend on the Colorado River.– Hardly Waite.
A Bureau of Reclamation study released Friday says the Colorado River’s worst drought in a century will force reduced water releases from Lake Powell that could affect agriculture, downstream business and hydroelectric power production.
Groups urging conservation warned of drastic cutbacks and severe economic implications while state officials and the Central Arizona Project sought to downplay the alarm.
The bureau said releases from Lake Powell in the coming year (water year 2014 runs from Oct. 2013 to Sept. 2014) will be cut from 8.23 million acre-feet to 7.48 million acre-feet — the lowest since the lake first filled in the 1960s. An acre-foot is roughly 325,000 gallons or enough to supply two households for one year.
Water from Lake Powell flows through the Grand Canyon to Lake Mead, where levels are expected to drop eight feet next year, causing reduced deliveries to farms and water banks.
“This is the worst 14-year drought period in the last 100 years,” said Larry Walkoviak, the bureau’s Upper Colorado Region director.
CAP officials emphasized that water delivery to towns and cities will not be affected. However, based on the bureau projections, they said shortages could trigger a 20 percent decrease in Arizona deliveries to agriculture.
Protect the Flows, a coalition of businesses that rely on the Colorado River, said the forecast dramatically increases chances of an “unprecedented water crisis within the next few years.”
“If drying trends continue,” the group warned in a news release, “lower water levels in Lake Powell could cut off power production at Glen Canyon Dam as soon as the winter of 2015, affecting power supply and pricing in six states.”
CAP stressed that, if the drought triggers a shortage and cutbacks in two years, it will not have an impact on municipalities, residential water users or Native American tribes.
Chuck Cullom, Colorado River project manager for the CAP, said that Lake Powell is only 45 percent full, the second-lowest level ever, and that Lake Mead is at 47 percent.
He confirmed that the forecast would trigger CAP cutbacks of 320,000 acre-feet, a 20 percent decrease. However, he expressed surprise at Protect the Flows’ dire warnings: “That’s not what the 24-month study will show. It is not Armageddon. It’s what we’ve been planning for for decades.”
Cullom said reduced generation of hydo-power is plausible, but it would occur only if the Colorado River drainage was hit with the two worst years of runoff on record.
Based on the federal projections, CAP is expecting a 9 percent reduction in Lake Powell releases during each of the next two years.
Sandra Fabritz Whitney, director of the state’s Department of Water Resources and chairwoman of the Arizona Water Banking Authority, said, “While the possibility of a shortage declaration is significant, Arizona has been planning and preparing for just such a condition.”
Still, conditions are so severe that Pat Mulroy, chief of the Southern Nevada Water Authority, told the Las Vegas Review-Journal that federal disaster aid is in order. “This is as much an extreme- weather event as (Hurricane) Sandy was on the East Coast,” he said. “The potential damage is just as bad.”
According to Protect the Flows, the Colorado River supports a $26 billion recreation economy. Craig Mackey, co-director of the coalition of 900 businesses, called for increased water conservation. He said that water demands from the river now exceed supplies and that climate change is making things worse.
“We’ve gotten to a point where we’ve never been before,” he said.
The National Young Farmers Coalition said more than three-quarters of the Colorado’s water goes to agriculture.
Kate Greenberg, the group’s Southwestern organizer, said the projections are “unprecedented” and point to an urgent need for conservation and water banking.
Source: AZcentral.com.
How Do Reverse Osmosis Units Know That the Storage Tank is Full?
Modern undersink reverse osmosis units use a simple but effective shutoff device to turn off water production when the unit’s storage tank is full. The shutoff system monitors the pressure in the storage tank and shuts off water coming into the RO membrane when tank pressure reaches approximately 2/3 of the pressure of the incoming tap water. Thus, a “full” tank in a standard RO unit is defined by the pressure of the water entering the RO unit. If incoming pressure is 60 psi, a full tank holds about 40 psi; if incoming pressure is 50, a “full” tank holds about 30 psi. Shutoff is done at around 2/3 of incoming pressure because as the tank fills increasing back pressure makes production less efficient. It isn’t practical to fill the tank past 2/3 full.
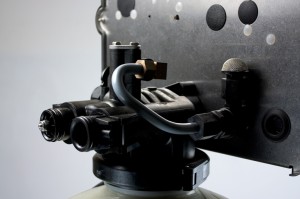
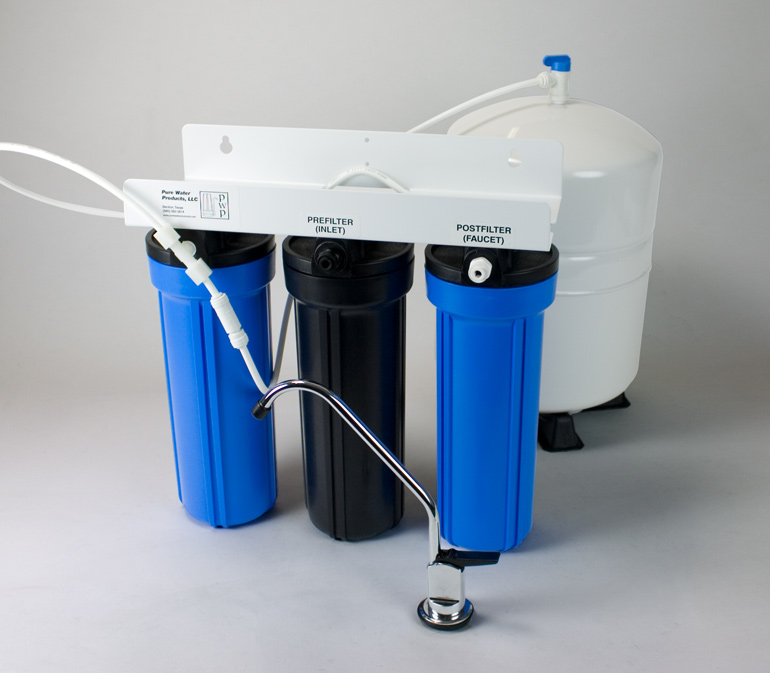
The Payne brand shutoff pictured above is installed as follows:
1. After water leaves the RO unit’s prefilter, it enters the “In” port of the shutoff valve, lower right in the picture. It then makes a horseshoe turn and exits the “Out” port, lower left in the picture, through which it flows to the inlet side of the RO membrane.
2. When the “permeate” water (the product water of the RO unit) leaves the other end of the membrane housing, it flows to one of the “tank” ports on the other side of the shutoff valve. It doesn’t matter which port it enters, since the “tank” ports are interchangeable and water flows either way on the permeate side of the valve. Water then makes a horseshoe turn inside the top side of the valve and leaves through the other tank port. From there it flows to the storage tank.
3. The two halves of the valve are separated by a piston, which keeps the permeate water on one side and the incoming tap water on the other. As long as the pressure on the tank side is less than 2/3 the pressure on the tap water side, the piston remains open and the unit continues to produce water. As the RO produces water and slowly fills the storage tank, however, pressure on the tank side of the piston eventually becomes strong enough to force the piston toward the tap water side and shut off the incoming tap water, stopping production. The RO unit stays off until enough water is removed from the storage tank to drop the pressure on the tank side of the piston, allowing tap water pressure to push the piston toward the tank side and start RO production again.
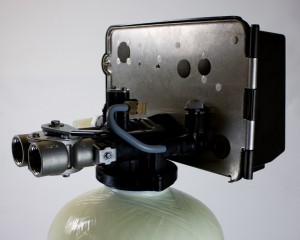
The Flowmatic shutoff valve above works exactly like the Payne valve, although the flow pattern is straight through rather than horseshoe style. In other words. water enters lower right and flows straight ahead through the valve and out the other side.
It is important to know that in order for the shutoff system to work, a check valve (one-way valve) must me installed in the permeate tube between the membrane and the shutoff valve. Without the check valve to hold the back pressure from the tank, the shutoff valve cannot function.
The Payne shutoff valve is clipped to the membrane housing of the unit above. The tubes on the right side carry tap water to the membrane. On the left, or “tank” side, permeate water leaves the membrane, passes through the cigar-shaped check valve, and enters one of the shutoff valve’s “tank” ports. It leaves via the other tank port and flows to the tee, which sends it to the storage tank.
Note that the inline check valve will not be found on most RO units, since RO manufacturers usually prefer a tiny, inexpensive check valve that”s contained in the elbow fitting where the permeate water leaves the membrane housing.
Troubleshooting your shutoff system
If you hear water running to drain more than you think it should or have some other reason to suspect that your RO unit isn’t shutting off properly, here’s an easy test you can do to check its performance.
Run a few glassfuls of water from the RO unit to start the unit producing water, then turn off the RO faucet and remove the drain line from the drain saddle connected to the undersink drain pipe. Drop the end of the drain line into a bottle or pan so that the drain water trickles into the container. Next, turn off the valve at the top of the RO storage tank. Water should stop flowing from the drain line within a couple of minutes. When it stops, leave the valve off, empty the container, put the tube back into the container, and come back in 10 minutes. If there is no water in the container, the shutoff system is working perfectly. The unit is shutting off and holding its shutoff.
If the drain fails to shut off, you need to find the reason. The main suspects are the shutoff valve or the check valve, not necessarily in that order.
If the drain shuts off initially, but comes back on during the 10 minutes, continue to watch it. If it comes on, runs briefly, then shuts off, and repeats this pattern over and over, you need a new check valve.
More about reverse osmosis shutoff valves and other reverse osmosis part
Stepping Out of the Bubble
by Elizabeth Cutright, Editor, Water Efficiency.
It can be hard sometimes, when you spend your days focused on one particular topic or issue, to realize that not everyone in the world shares your insights or perspectives. In fact, we often become so entrenched in our own little bubbles that we forget that not everyone is privy to the same facts and figures, the same experiences, or the same common sense.
While I know better, it’s hard sometimes to avoid glancing at the comments that usually appear at the end of a blog post of news story. I’m well aware of the fact that most of the time, Internet commentators are operating from the lowest common denominator and that the “trolls” are there to do nothing more than stir up controversy. And yet … despite my complete understanding of the inevitable, more often than not I find myself scrolling through responses and unregulated opinions that often follow a piece of online content.
I share all of this because today, I was truly surprised to learn that there is perhaps a small, but nevertheless vocal, online contingent that does not believe in water conservation. These folks believe that water scarcity is all “hype”, that it is all part of a “liberal agenda” aimed at curbing economic expansion and turning the US into a fascist, socialist utopia.
Here’s a sampling of the responses to a story aimed at “debunking the myth of peak water.”
* “The only way to truly wastewater would be to launch it out of the atmosphere. Otherwise, all other uses of water puts it back into the system sooner or later.”
* “Just another example of the eco-lemmings having to have something to worry about. I have no doubt that ‘the science is settled’.”
* “These graft-seeking scaremongers would find my generous aquifer quite inconvenient.”
* “The nutty left, God bless them, have picked something that is 100% recyclable, is 100% recycled, and easily made potable (safe to consume).”
* “I don’t see how electrical generation consumes ANY water. Running it through the hydropower turbines does nothing harmful to it. Downstream it goes where it can be drawn by the downriver users.”
* “Baah! If vast amounts of irrigation water (and crops and jobs) can be sacrificed to save the Delta Smelt, it’s not even remotely possible that this is anything resembling an actual ‘issue’. Lots of vilification for urbanization (are liberals so stupid they do not to realize where their ‘base’ is located?) yet nary a snear (sic) for the Smelt! Baah!”
It’s frustrating to see the facts muddled with myth to produce an obstinate view of reality. While all of us could pick apart each of the above statements (as well as the article itself), the truth is we shouldn’t have to. If the public is really questioning water conservation efforts, then those of us working in water resource management have failed.
Water scarcity shouldn’t be up for debate. Water conservation shouldn’t be politicized. Water efficiency shouldn’t be downplayed or mocked.
The truth is, there is no need to label our current water resource situation with cute catchphrases like “peak water” (a term that because of its unsuitable application loses all meaning). Reality speaks for itself. In the end, it’s not about political affiliation or ideological perspectives; it’s about responsible resource consumption and an awareness that we cannot operate as if we live in a self contained bubble.
As these commentators were so quick to point out the water cycle is all-inclusive—water goes out and water goes in, in equal measure. We may not “lose” what we have, but if we’re not careful, we will lose the ability to use what we have left.
Source: Water Efficiency.
New York in 200 Years?
adapted from Rising Seas by Tim Folger.
Why the Seas Rise
Unless we change course dramatically in the coming years, our carbon emissions will create a world utterly different in its very geography from the one in which our species evolved. “With business as usual, the concentration of carbon dioxide in the atmosphere will reach around a thousand parts per million by the end of the century,” says Gavin Foster, a geochemist at the University of Southampton in England. Such concentrations, he says, haven’t been seen on Earth since the early Eocene epoch, 50 million years ago, when the planet was completely ice free. According to the U.S. Geological Survey, sea level on an iceless Earth would be as much as 216 feet higher than it is today. It might take thousands of years and more than a thousand parts per million to create such a world—but if we burn all the fossil fuels, we will get there.
No matter how much we reduce our greenhouse gas emissions, Foster says, we’re already locked in to at least several feet of sea-level rise, and perhaps several dozens of feet, as the planet slowly adjusts to the amount of carbon that’s in the atmosphere already. A recent Dutch study predicted that the Netherlands could engineer solutions at a manageable cost to a rise of as much as five meters, or 16 feet. Poorer countries will struggle to adapt to much less. At different times in different places, engineering solutions will no longer suffice. Then the retreat from the coast will begin. In some places there will be no higher ground to retreat to.
By the next century, if not sooner, large numbers of people will have to abandon coastal areas in Florida and other parts of the world. Some researchers fear a flood tide of climate-change refugees. “From the Bahamas to Bangladesh and a major amount of Florida, we’ll all have to move, and we may have to move at the same time,” says Wanless. “We’re going to see civil unrest, war. You just wonder how—or if—civilization will function. How thin are the threads that hold it all together? We can’t comprehend this. We think Miami has always been here and will always be here. How do you get people to realize that Miami—or London—will not always be there?”
What will New York look like in 200 years? Klaus Jacob, the Columbia geophysicist, sees downtown Manhattan as a kind of Venice, subject to periodic flooding, perhaps with canals and yellow water cabs. Much of the city’s population, he says, will gather on high ground in the other boroughs. “High ground will become expensive, waterfront will become cheap,” he says. But among New Yorkers, as among the rest of us, the idea that the sea is going to rise—a lot—hasn’t really sunk in yet. Of the thousands of people in New York State whose homes were badly damaged or destroyed by Sandy’s surge, only 10 to 15 percent are expected to accept the state’s offer to buy them out at their homes’ pre-storm value. The rest plan to rebuild.
This isn’t an artist’s vision of what New York will look like in 2210. It is a photo of present-day Manila where the rising sea keeps nibbling away at the waterfront homes of the poor.
Source: National Geographic.
Brackish Water: A Slippery Subject
An exact definition of what is commonly called “brackish” water is hard to pin down. Brackish water falls between seawater and fresh water. Brackish water is similar to seawater except the salt content is less, as are the TDS (total dissolved solids). In another way of classifying, you start with fresh water, then go to brackish water, then to saline water, then to brine. The specifics of these classifications are often blurred.
One authority states that brackish water begins at about 1000 ppm TDS and runs upward to around 10,000 or 12,000 ppm TDS.
The basic process of treating brackish water in desalination applications is to pass pressurized water through a membrane. As fresh water passes through the membrane, brine or wastewater is rejected.
Seawater treatment applications differ from brackish mainly in the level of osmotic pressure required to achieve fresh water.
Typically, the pressure needed ranges in brackish water treatment from 5 psi to 75 psi, although the majority of brackish applications fall in the 145 psi to 290 psi range.
Brackish water is generally a surface-type water and as such can be influenced by such environmental factors as rainfall and humidity.
Ion levels and bacteria could be higher in the summer months compared to winter months, and salinity, nitrates, iron, silica and bacteria are a few examples of what is common in untreated brackish water.
Viewed another way, brackish water is water that has more salinity than fresh water, but not as much as seawater. It may result from mixing of seawater with fresh water, as in estuaries, or it may occur in brackish fossil aquifers. The word comes from the Middle Dutch root “brak,” meaning “salten” or “salty”.
Certain human activities can produce brackish water, in particular certain civil engineering projects such as dikes and the flooding of coastal marshland to produce brackish water pools for freshwater prawn farming. Brackish water is also the primary waste product of the salinity gradient power process. Because brackish water is hostile to the growth of most terrestrial plant species, without appropriate management it is damaging to the environment.
Technically, brackish water contains between 0.5 and 30 grams of salt per litre—more often expressed as 0.5 to 30 parts per thousand (ppt or ‰). Thus, brackish covers a range of salinity regimes and is not considered a precisely defined condition. It is characteristic of many brackish surface waters that their salinity can vary considerably over space and/or time.
Here is a chart from the Wikipedia:
|
Water salinity based on dissolved salts in parts per thousand (ppt)
|
|||
|---|---|---|---|
|
Brackish water
|
|||
|
< 0.5
|
0.5 – 30
|
30 – 50
|
> 50
|
In summary, brackish water lies in definition somewhere between fresh water and sea water and is defined mainly by its salt content.
Treatment is almost exclusively by membrane technology (reverse osmosis) or by distillation.
References: Water Technology “Technical Feature” (March 2010) by Rich DiPaolo, Wikipedia, The Pure Water Occasional.
Pure Water Gazette Fair Use Statement
The Basics of Compression and Pipe Threads Used in Water Filters
Like most professions, the water treatment industry runs on initials. Here are a few more.
There is often confusion about the threads on the fittings and connectors used in water treatment in particular and small-pipe plumbing in general. Things used to be more complicated when undersink plumbing had such exotic creatures as flare, fine flare, and Texas fine flare fittings to contend with. Now almost everything is done with compression fittings, pipe fittings, or the super convenient plastic push-in fittings.
The push-ins are easy. With threaded fittings, what confuses people usually is the distinction between a pipe fitting and a compression fitting. The picture below has both threads. It’s hard to see the difference, but there is a difference.
The taper of the threads is what actually distinguishes pipe from compression fittings. On bottom of the fitting in the picture is a male pipe thread; on top is a male compression thread with nut. Pipe threads connect the fitting to another solid component, like a filter housing or a rigid metal pipe. The compression fitting with cap connects a tube to the fitting. The pipe fitting is taped with teflon tape to insure a seal. The compression fitting is not taped.
The real confusion with pipe fittings comes from the fact that they have so many different descriptive names.
MIP stands for Male Iron Pipe, or some would say Male International Pipe. The same pipe size can also be called MPT, for Male Pipe Thread.
FIP means Female Iron (or International) Pipe and can also be called FPT for Female Pipe Thread.
To add confusion, there is NPT, which stands for National Pipe Thread. The Wikipedia makes this as confusing as possible:
Sometimes NPT threads are referred to as MPT (‘Male Pipe Thread’), MNPT, or NPT(M) for male (external) threads; and FPT (‘Female Pipe Thread’), FNPT, or NPT(F) for female (internal) threads. An equivalent designation is MIP (Male iron pipe) and FIP (Female iron pipe). Also the terms NPS and NPSM are sometimes used to designate a straight, not tapered, thread. (This should not be confused with NPS meaning Nominal Pipe Size.)
Got it?
I won’t bore you with the actual taper of pipe thread patterns. The main thing you need to know when dealing with water treatment equipment is that compression caps won’t work on pipe threads and you can’t screw male compression thread into a female fitting (like a filter housing port) that’s made for pipe.
See also Pure Water Annie’s Glossary of Water Treatment Terms on the Pure Water Occasional’s website.
China and India ‘water grab’ dams put ecology of Himalayas in danger
More than 400 hydroelectric schemes are planned in the mountain region, which could be a disaster for the environment
by John Vidal
Gazette Editorial Note: It is ironic that while governments are looking frantically for resources to remove ageing dams, new dams are being built at an alarming rate. Another of the 10,000 easy to find examples that humans are very bad at learning from our mistakes.–Hardly Waite.
The future of the world’s most famous mountain range could be endangered by a vast dam-building project, as a risky regional race for water resources takes place in Asia.
New academic research shows that India, Nepal, Bhutan and Pakistan are now engaged in a huge “water grab” in the Himalayas, as they seek new sources of electricity to power their economies. Taken together, the countries have plans for more than 400 hydro dams which, if built, could together provide more than 160,000 MW of electricity – three times more than the UK uses.
In addition, China has plans for around 100 dams to generate a similar amount of power from major rivers rising in Tibet. A further 60 or more dams are being planned for the Mekong river which also rises in Tibet and flows south through south-east Asia.
The Ranganadi hydroelectric project in Arunachal Pradesh, India
Most of the Himalayan rivers have been relatively untouched by dams near their sources. Now the two great Asian powers, India and China, are rushing to harness them as they cut through some of the world’s deepest valleys. Many of the proposed dams would be among the tallest in the world, able to generate more than 4,000MW, as much as the Hoover dam on the Colorado river in the US.
The result, over the next 20 years, “could be that the Himalayas become the most dammed region in the world”, said Ed Grumbine, visiting international scientist with the Chinese Academy of Sciences in Kunming. “India aims to construct 292 dams … doubling current hydropower capacity and contributing 6% to projected national energy needs. If all dams are constructed as proposed, in 28 of 32 major river valleys, the Indian Himalayas would have one of the highest average dam densities in the world, with one dam for every 32km of river channel. Every neighbour of India with undeveloped hydropower sites is building or planning to build multiple dams, totalling at minimum 129 projects,” said Grumbine, author of a paper in Science.
China, which is building multiple dams on all the major rivers running off the Tibetan plateau, is likely to emerge as the ultimate controller of water for nearly 40% of the world’s population. “The plateau is the source of the single largest collection of international rivers in the world, including the Mekong, the Brahmaputra, the Yangtse and the Yellow rivers. It is the headwater of rivers on which nearly half the world depends. The net effect of the dam building could be disastrous. We just don’t know the consequences,” said Tashi Tseri, a water resource researcher at the University of British Columbia in Canada.
“China is engaged in the greatest water grab in history. Not only is it damming the rivers on the plateau, it is financing and building mega-dams in Pakistan, Laos, Burma and elsewhere and making agreements to take the power,” said Indian geopolitical analyst Brahma Chellaney. “China-India disputes have shifted from land to water. Water is the new divide and is going centre stage in politics. Only China has the capacity to build these mega-dams and the power to crush resistance. This is effectively war without a shot being fired.”
According to Chellaney, India is in the weakest position because half its water comes directly from China; however, Bangladesh is fearful of India’s plans for water diversions and hydropower. Bangladeshi government scientists say that even a 10% reduction in the water flow by India could dry out great areas of farmland for much of the year. More than 80% of Bangladesh’s 50 million small farmers depend on water that flows through India.
Engineers and environmentalists say that little work has been done on the human or ecological impact of the dams, which they fear could increase floods and be vulnerable to earthquakes. “We do not have credible environmental and social impact assessments, we have no environmental compliance system, no cumulative impact assessment and no carrying capacity studies. The Indian ministry of environment and forests, developers and consultants are responsible for this mess,” said Himanshu Thakkar, co-ordinator of South Asia Network on Dams, Rivers and People.
China and India have both displaced tens of millions of people with giant dams such as the Narmada and Three Gorges over the last 30 years, but governments have not published estimates of how many people would have to be relocated or how much land would be drowned by the new dams. “This is being totally ignored. No one knows, either, about the impact of climate change on the rivers. The dams are all being built in rivers that are fed by glaciers and snowfields which are melting at a fast rate,” said Tsering.
Climate models suggest that major rivers running off the Himalayas, after increasing flows as glaciers melt, could lose 10-20% of their flow by 2050. This would not only reduce the rivers’ capacity to produce electricity, but would exacerbate regional political tensions.
The dams have already led to protest movements in Uttarakhand, Himachal Pradesh, Sikkim, Assam and other northern states of India and in Tibet. Protests in Uttarakhand, which was devastated by floods last month, were led by Indian professor GD Agarwal, who was taken to hospital after a 50-day fast but who was released this week.
“There is no other way but to continue because the state government is not keen to review the dam policy,” said Mallika Bhanot, a member of Ganga Avahan, a group opposing proposals for a series of dams on the Ganges.
Governments have tried to calm people by saying that many of the dams will not require large reservoirs, but will be “run of the river” constructions which channel water through tunnels to massive turbines. But critics say the damage done can be just as great. “[These] will complete shift the path of the river flow,” said Shripad Dharmadhikary, a leading opponent of the Narmada dams and author of a report into Himalayan dams. “Everyone will be affected because the rivers will dry up between points. The whole hydrology of the rivers will be changed. It is likely to aggravate floods.
“A dam may only need 500 people to move because of submergence, but because the dams stop the river flow it could impact on 20,000 people. They also disrupt the groundwater flows so many people will end up with water running dry. There will be devastation of livelihoods along all the rivers.”
Source: The Guardian.